This thread has been locked.

If you have a related question, please click the "Ask a related question" button in the top right corner. The newly created question will be automatically linked to this question.

ADS131M04EVM: EVM GUI data consult

Part Number: ADS131M04EVM

Hi,

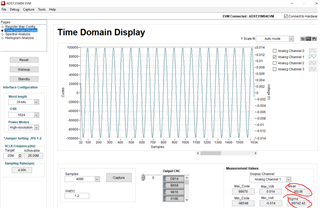
  After sampling, we got below picture.

  could you help us to understand the two circles data meaning?

  if we want to get RMS value, how could we convert current value into RMS value?(How about Max/ 1.414?)
  • Hello Shuang Feng,

    Mean and Sigma refer to the data set of codes in the current time domain display (after clicking capture). Mean referring to statistical mean and Sigma referring to standard deviation (in the context of codes, not voltage).

    I'm not sure which gain setting you have and if that VREF in the window is accurate but you should have everything you need to convert from codes to voltage. If you need help with that, there's a really helpful blog about it: https://e2e.ti.com/blogs_/archives/b/precisionhub/posts/it-s-in-the-math-how-to-convert-adc-code-to-a-voltage-part-1 . To expand on this, you can also export the data and import it into the Analog Engineer Calculator https://www.ti.com/tool/ANALOG-ENGINEER-CALC but the histogram and spectral analysis tab should be enough for analysis if you know how to convert.

    As for RMS, you have the right idea. We have a sinusoid with a peak to peak value that can be converted to RMS with V_peak/sqrt(2) or V_peak/1.414 . Again, assuming the VREF is right and the register map PGA Gain field has not been changed since you took this data, the GUI should be correctly converting the peak code to the correct voltage. You can always double check using the blog post math I posted above. 

    Best,

    -Cole