This thread has been locked.

If you have a related question, please click the "Ask a related question" button in the top right corner. The newly created question will be automatically linked to this question.

ADS1299 Frequency Response: Unknown Lowpass Filter influence

Other Parts Discussed in Thread: ADS1299

Hello everyone.


I have been working with an ADS1299 design quite successfully so far - until I finalized the evaluation process for faster biosignals:

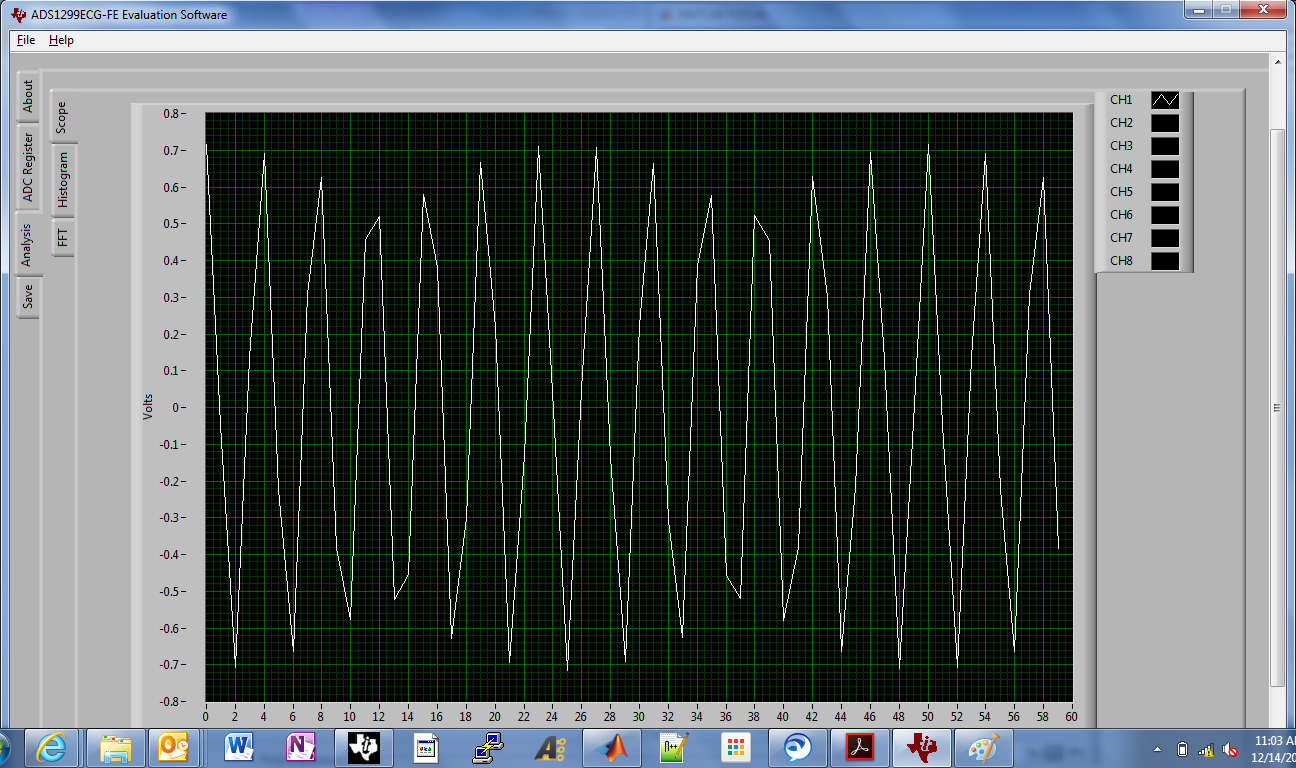
Measuring the Frequency response of the system, I found an unknown low-pass source cutting off the signal way too early (-3dB @~50Hz).
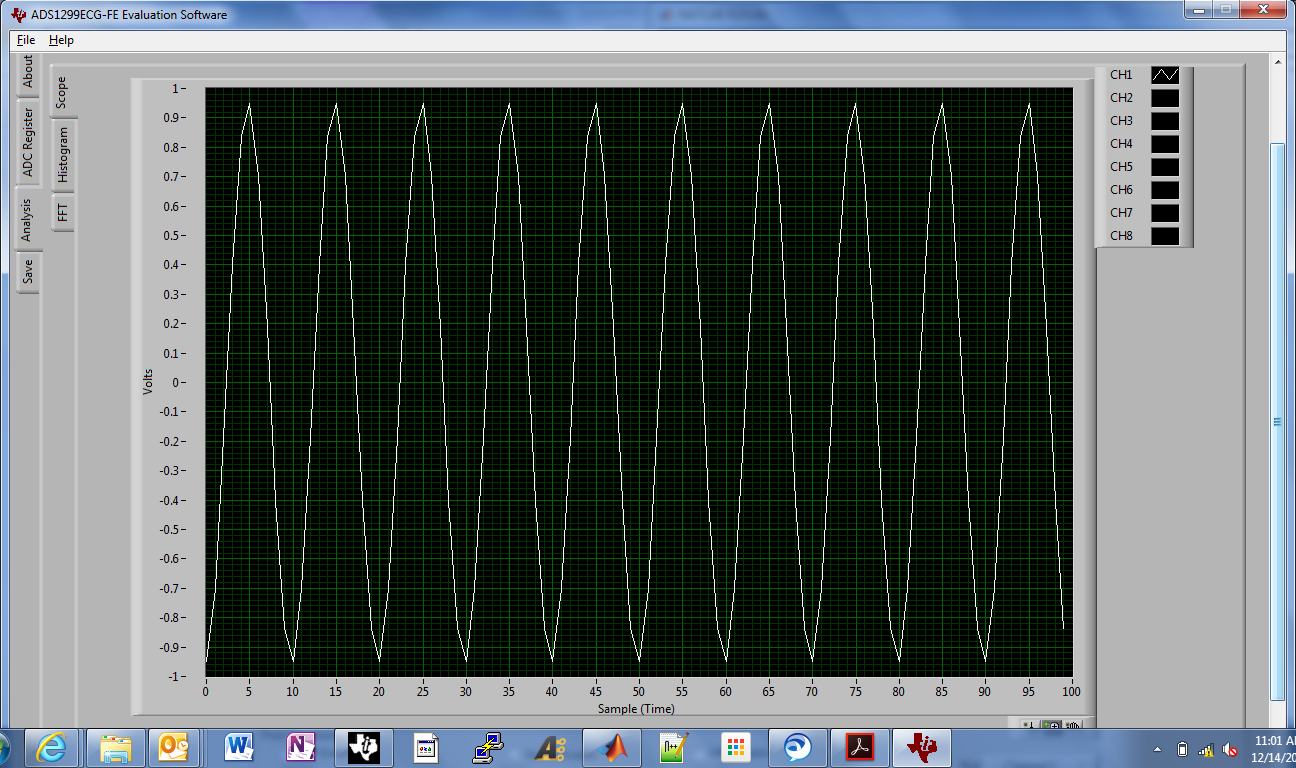
I did manual sine source input and a frequency sweep analysis, both with the same results.

The only design elements between electrode input and ADS1299 IN1-8P/N Inputs are passive RC Lowpasses with a cutoff of ~530Hz (3kOhm|100nF) for each input. Negative inputs are shorted to one common input RC with the same values and one common electrode. All R/C elements were manually re-checked.
I use a samplerate of 500Hz which - according to datasheet - should lead to a ~130Hz input bandwidth of the chip - still way above the measured 50Hz.

This means that from 1-100 Hz the frequency response is neither completely flat, nor linear!?:
EEG Example: In Alpha (8-13 Hz) the attenuation already differs around about 8%. (8hz: 0% - 13Hz: 8%).
This can not be a characteristic of the ADS1299, can it?

I would be glad to get some information on possible sources for this behaviour - and upload the sweep-data and a snippet of the analog design for your convenience (unfortunately I did not find a way of doing this with the forum mask so far).

Thank you for any ideas or reports of similar issues!

Alex

  • Hey Alex,

    This device, like all delta sigma ADCs contains a digital decimation filter which takes samples collected at a high frequency and down-samples them to the data rate, which in your case is 500 SPS. The behavior of that filter is specified beginning on page 21 in the datasheet. However at 50 Hz, a quick calculation shows the attenuation should be a little more than half a decibel; not 3 dB.

    In addition to that source, the input PGA has a single pole roll-off at low frequencies which can be modeled like an RC filter the typical cutoffs for which are given on page 19 of the datasheet.

    What you are describing is not characteristic behavior of the chip itself, but could well be a combination of factors from multiple sources. Could you provide me with your schematic? I could try to simulate the behavior you are seeing.

    Regards,
    Brian Pisani
  • Hello Brian,
    thank you for you quick answer! I sent a friendship request to exchange email/whatever necessary to give you access to my schematic (and in case you wish, the measured sweep data).

    Thanks also for the remarks on Digital Decimation filter and PGA - I know the corresponding datasheet pages but could not successfully explain the observed data with the information given there! The PGA is running at G=1 in my current measurements (sine has 100mVpp - but the frequency response proved to be rather independent of signal amplitude to a certain degree). At G=1 the PGA bandwidth is given to be 662kHz, so I did not consider it could play a role!

    Furthermore, in the meantime, I implemented a design with 1kHz Datarate - and cutoff frequency- unsurprisingly - shows clear correlation with the DDF settings/DataRate. So, at least I am quite sure the issue comes from within the chip(configuration) and is not solely caused by external components.

    I would be very thankful for any simulation/investigation and results that could explain this behavior!

    Regards
    Alex
  • Hey Alex,

    I could not correlate the behavior you described with any aspect of the schematic. Could you send me the data you collected? In addition, have you verified that the signal which reaches the inputs of the device is at the amplitude you expect? When you send the data, please include all relevant board configurations/device register settings.

    Regards,
    Brian Pisani
  • Hello Brian,

    sent you the data and configuration!
    Yes, I verified that the signal to INxN/P of the IC has the expected amplitude(s). Looking forward to hear more from you.
    Is there any inhouse data on the frequency response of the ADS1299 amplifiers at certain settings (such as fixed gain/datarate) that you could share?

    Regards
    Alex
  • Hey Alex,

    The expansive data that was collected before this device released was use to make the datasheet. The data would not indicate the frequency response you are seeing. In addition, TI warrants its products to meet or exceed the specifications in its datasheets. Performance was validated through silicon characterization, simulation, and a production test.

    One thing I noticed is that in your plot of the frequency response, there is a jump from 50 Hz to a little over 100 Hz where the response is not smooth. Neither the PGA nor the digital filter could be responsible for such a transition. Is it possible that there is a bug in the program which captures the magnitudes of signals and relates them to the frequency? Perhaps an erroneous parameter? Have you spot checked the results by manually changing the frequency of the input and observing the output with the same magnitude as is suggested by this data? If so, with what granularity have you incremented frequency?

    Regards,
    Brian Pisani
  • Dear Brian,

    as I wrote in the email, "Please note, that there seems to be one measurement error (probably by manual mistake) at X=50/100Hz.
    However it is clear, that the -3dB cutoff is at ~23Hz.". I can guarantee that the issue is not with the evaluation software. The one erroneous measurement was quite certainly due to a manual fault.

    The incrementation granularity is also in the "fr_manual_data.mat" I sent you:
    for 0.1-1Hz in 0.1Hz steps
    for 1-50Hz in 1Hz steps
    for 50-400Hz in 50Hz steps
    for 400-2kHz in 100Hz steps.


    As I indicated before, interestingly, the 3dB cutoff frequency increases with higher samplerate, (as expected and documented in the datasheet) due to the DDF sinc filter change, (at least in my IC) is not at the points given in Table 1 of the datasheet but at lower ones.
    I just asked for a typical measurement of the frequency response at fixed PGA/DR settings because I repeated the frequency response measurements with an older iteration of my current design - and it showed the same characteristics. Since two different ADS1299 showed the same characteristics (mainly using the same schematics which so far did not seem to be the issue), I had hoped to hear about the experience of other users to find out more about this issue!

    Kind regards
    Alex

  • Hey Alex,

    I am missing the matlab file of measured data for the manual sweep "fr_manual_data.mat". I cannot find it attached to your original email. Can you please send that to me?

    No other users have experienced this issue that I am aware of. The digital filter is a deterministic state machine whose transfer function has been designed and tested extensively to produce the output which is specified in the datasheet. Later today I will go to the lab and spot check the transfer function using an EVM. I will let you know the results.

    Regards,
    Brian Pisani
  • Hello Brian,

    I resent the data in a zipped file, as parts seem to have been deleted by your inhouse antivir/spam software(?) - .
    Let me know if you need it in any other format/way.

    Looking forward to any results!
    Regards
    Alex

  • Hey Alex,

    I got the data. The manual collection file looks very similar to the automated one from before. I was looking more for just some data that you collected manually changing the input frequency on your signal generator and then just writing down the output magnitude. In any case, I collected data with the ADS1299 EVM, the schematic for which you can find on the web, but trust in knowing it is very similar to yours. I collected "single-ended" data where I enabled the BIAS amplifier as a simple buffer set to mid-supply, and connected IN1N and the signal generator ground to that net. I then applied the signal generator positive output to IN1P an collected data with the EVM GUI.

    The first signal I applied was a 1 Vp 50 Hz sine wave using the 500 SPS data rate. The image is below. As you can see, attenuation is minimal as expected. Certainly nowhere near the 0.707 V which corresponds to a -3 dB attenuation.

    Next, I applied at 1 Vp 130 Hz sine wave while still collecting at 500 SPS. This time the signal is modulated a little bit in the utility frequency (60 Hz, likely from fluorescent lighting), but you can see that the signal attenuates to near the -3 dB point. That image is below.

    Out of curiosity, I switched the data rate to 250 SPS and again applied a 1 Vp 50 Hz signal. I saw a significant amount of attenuation; very close to the -3 dB point for the input sine wave. The image is below. Are you certain that you have changed the data rate in the CONFIG1 register? What happens when you read it back? Have you seen the time between DRDY signals by looking at them with an oscilloscope?

    I hope this helps,

    Regards,

    Brian Pisani 

  • Hello Brian,

    thank you very much for your further investigation!

    > Are you certain that you have changed the data rate in the CONFIG1 register? What happens when you read it back? Have you seen the time between DRDY signals by looking at them with an oscilloscope?

    Yes I am sure to run on 500SPS, confirmed by both, the DRDY signal on the oscilloscope and the amount of samples I log every second.
    Currently, I am further investigating on other possible sources for the LP behavior, mainly in the code of the µC communicating with the IC.

    I will get back to you as soon I have further information!
    Best regards

    Alex