This thread has been locked.

If you have a related question, please click the "Ask a related question" button in the top right corner. The newly created question will be automatically linked to this question.

ADS61B29 ADC Performance degradation

Other Parts Discussed in Thread: ADS61B29

Hi,


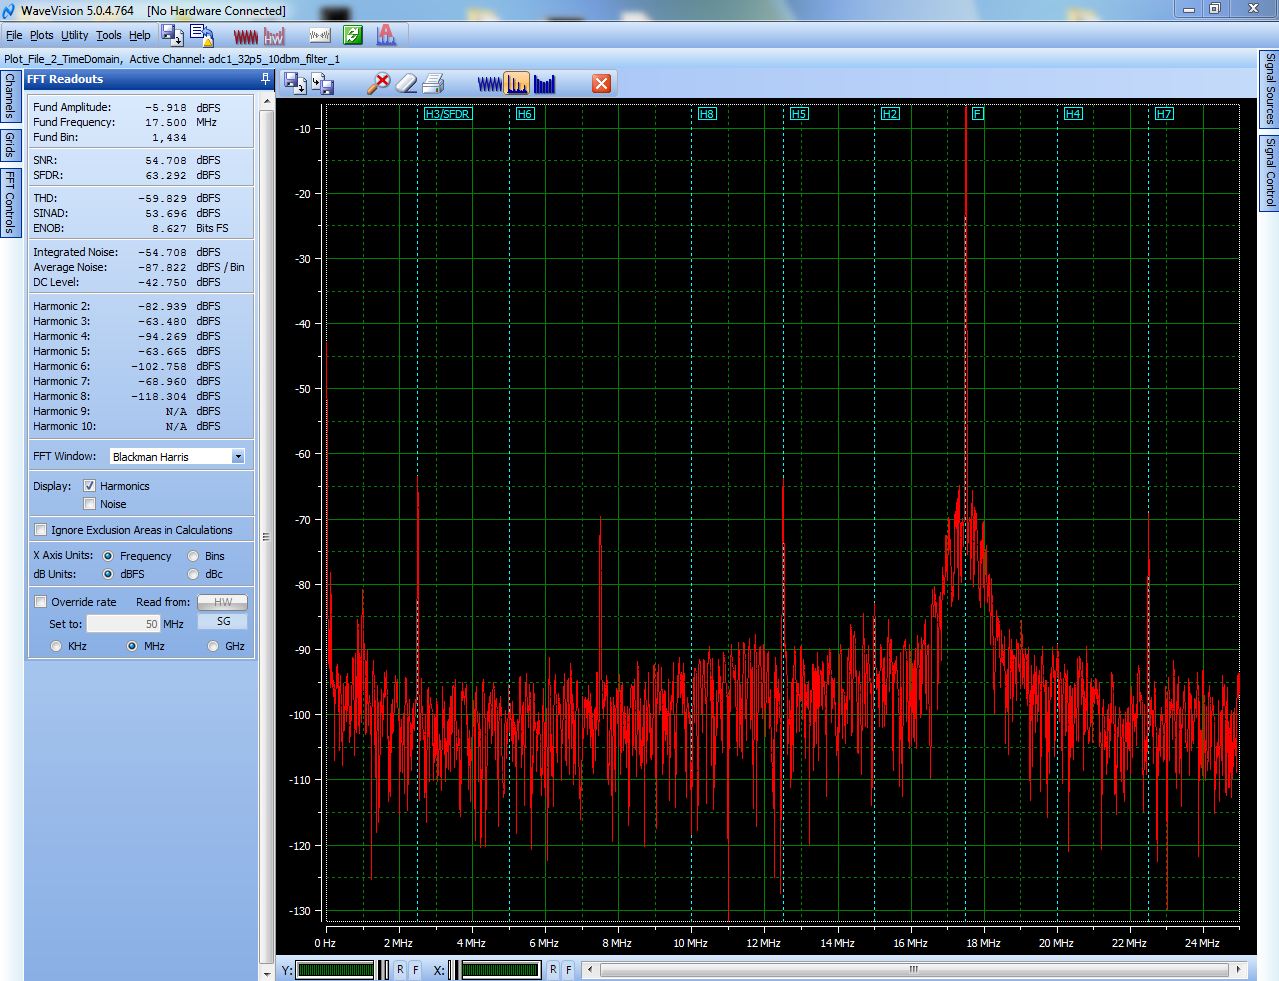
We are using ADS61B29 at 50MSPS in our board. We are feeding a input of 32.5MHz at -6dBFS. When we capture the digital data and plot it in wavevision, we are seeing a unexpected degradation in SFDR and ENOB. We are seeing the harmonics with considerable amplitude as shown the FFT below:


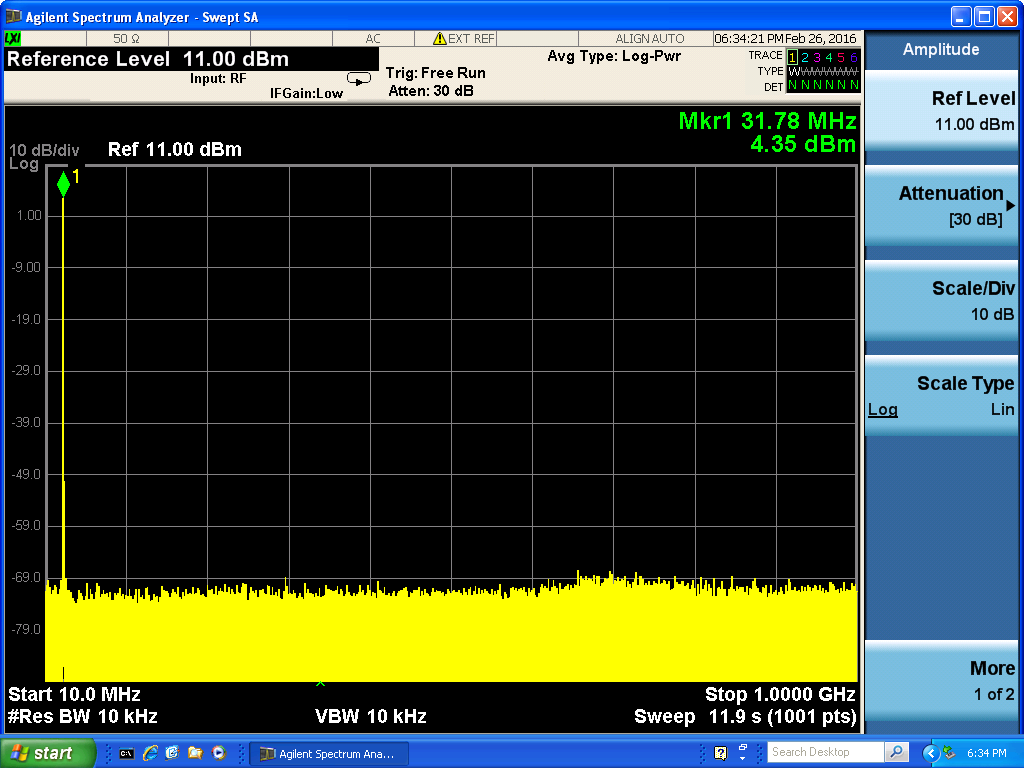
The input signal fed to ADC is analyzed using spectrum analyzer and screenshot is shown below:


The following figure is the FFT of digital data when ADC input is terminated with 50ohms:


Please help us to proceed further. What could be the problem for this?

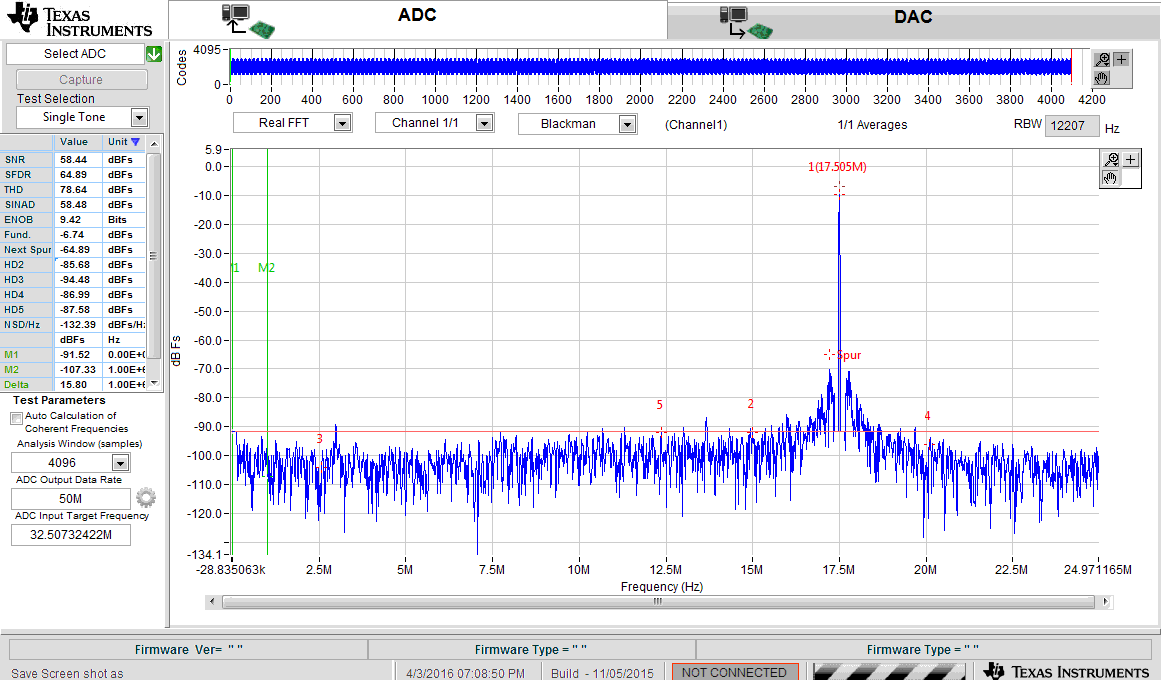
Edit 1: HSDC Pro screenshot also included. :

Edit 2:

We were using on board oscillator generated clock. Changed to external clock and captured. The plot is :

Edit 3:

Signal source is changed to R&S signal generator as suggested by Richard :

  • Rakend,

    Running at 50MSPS, this device must be set in Low SPeed Mode. Has this been done?

    Have you tried importing the data into HSDC Pro? There is a bug in the WaveVIsion 5 data import functions that incorrectly sets the resolution and therefore sets the scale wrong. It may be that you are clipping a little bit.

    Regards, Josh

  • Hi,

    Also, if you can write the SPI registers then make use of the test patterns that can be enabled in address 0x62.  Two useful patterns are the ramp pattern (which is an arithmetic counting on the output sample - 0x000, then 0x001, then 0x002, etc.) and the custom pattern (which is a pattern that you set in a SPI register that then is output on the sample bus.)  With custom pattern, you can put a single '1' with the rest '0' and see if you capture the '1' in the right spot in the sample.  Then you can walk that '1' through all the bit positions in the sample.  In this way you can verify that you don't have something like inverted DDR clock that swaps all you odd bit positions with even bit positions.

    Regards,

    Richard P.

  • Hi,

    Thanks for the reply.

    The device is set in Low speed mode using SPI registers. And I haven't tried that on HSDC Pro. I'll try and post the results.

    And the problem I've seen in setting it in Ramp pattern is that the 12 bit ADC will discard LS 2 bits of the digital data.. (explained in e2e.ti.com/.../1775332). When I used custom pattern I can see proper captured data. For this confirmation, I've fed 1MHz input to the ADC and captured data and plotted. The plotted wave was correct. If there is any bit swap, this plot will not be correct, right?
  • Hi Josh,

    I tried HSDC Pro. I'm not able to plot the FFT from a .dat file, since I'm new to HSDC Pro. Since wavevision is able to plot the DDS generated data correctly, how there can be issue with only ADC data ? Please help me with this.
  • Hi,

    Edited post and Added HSDC Pro screenshot. I'm seeing slight variation with wavevision results. But still the expected performance is not achieved.
  • Hi,

    What is the source of your 50MHz sample clock?  And are you using a narrow bandpass filter to remove as much phase noise from the clock as possible?  It does appear that you are getting a lot of phase noise around your fundamental, enough to pull up the rms of your noise floor (red line at around -91 or -92 dBFS).  With BlackmanHarris windowing function, the HSDCPro will notch out +/-25 FFT bins around the fundamental and replace that with the rms value, which is easy to see with only 4096 samples.  if you use the pull-down menu options you can find a place to change that 25 bins of notching to zero and really see what is happening around the fundamental.   I would start by looking at the clocking.

    Regards,

    Richard P.

  • Hi Richard,
    Thanks for the reply.

    We were using on board clock and we changed to external clock by which the harmonics are vanished from the captured data. But still if we see the SNR,SFDR and ENOB there isn't much improvements. So what can we do next?

    Thanks a lot!!

    Edit: Post has been edited and included that new plot.

  • Hi,

    I still don't know what you are using for clock, though.  What is your signal source?  If you want to see SNR, SINAD, ENOB near datasheet specifications then you will need a high quality low-jitter signal source, something like a Rohde&Schwartz SMA100 as one such example.  And even with that you would need to use a narrow bandpass filter on the clock such as a TTE LC filter with 3% or 5% passband. 

    For on-board clock - you were using the CDCE72020?  That is the only on-board clock that I know of and the VCXO and much of the surrounding components are not installed during manufacture as we don't know in advance what sample frequency the EVM might be used at. 

    Regards,

    Richard P.

  • Hi Richard,

    Thanks for the reply. We are getting better results when the input source is changed to Rohde&Schwartz. Post has been edited with the screenshot.