This thread has been locked.

If you have a related question, please click the "Ask a related question" button in the top right corner. The newly created question will be automatically linked to this question.

ADS1247: Repeated data patterns in noise floor

Part Number: ADS1247

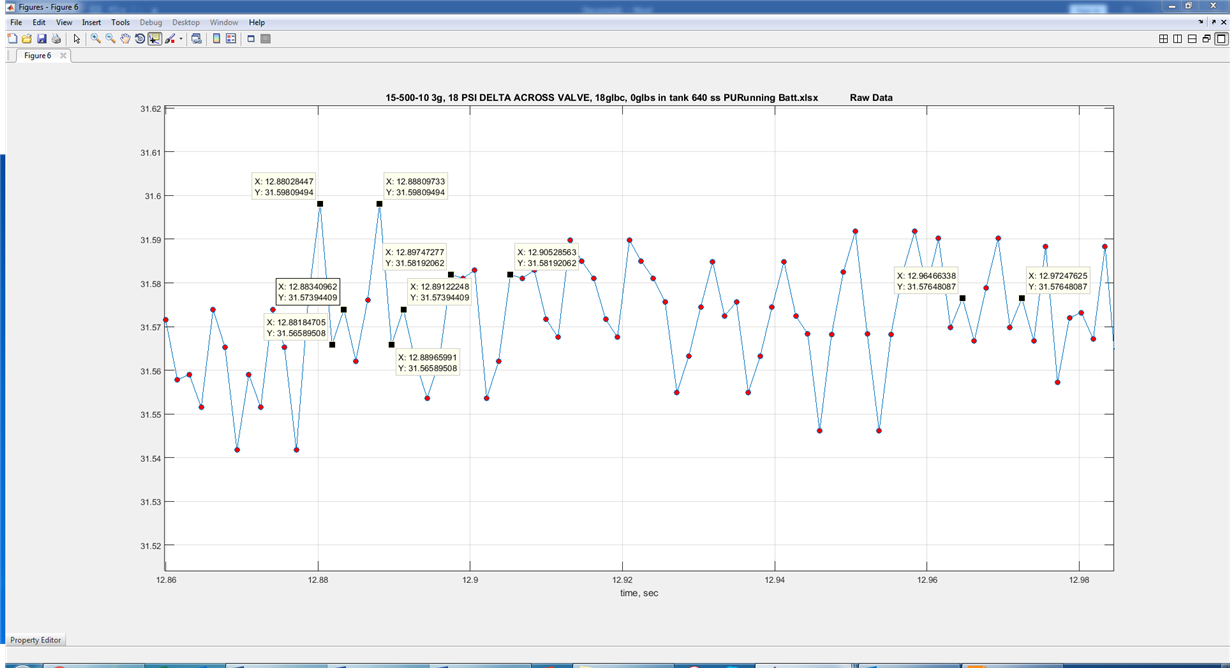
I have a customer using a product of ours with the ADS 1247, and they are trying to measure a pulse that is not much bigger than the noise floor.  The problem is that they are seeing sets of 2 repeated data patterns, separated by one or more non repeating data points. The sensor is in continuous sample mode, and the microprocessor is polling the Busy pin before taking another data point.  Our custom software takes the data of the device and translates it into process units. I would expect to see repeated data points at the step size of the ADC, but not 3 data points precisely repeated.  Any insight?   
  • Hi Scott,

    It is not clear what the real issue is here. There are a finite number of ADC codes and any of those codes could be repeated. It also appears that the results you show are a math conversion. Depending on the floating point math there could be rounding error or limitations to the floating point math engine that limits the outcome to a specific number of digits. Although at this level of precision it would seem unlikely to have repeated values, it is certainly possible. It would be helpful to see the ADC raw codes to compare prior to any math manipulation or conversion.

    Best regards,
    Bob B
  • Data Patterns.pdfThanks Bob...I am not worried about repeated codes.. you will see this in the noise floor or with a stable DC value.  I am more worried about the repeated patterns.  I realize there are a few layers here between the raw ADC output and the process value. I guess what I was thinking that TI could provide, based on past experience, is whether certain conditions could cause the duplicate code pattern (for instance...hypothetically...harmonics beyond the Nyquist frequency causing foldback aliasing into the  frequency spectrum we are interested in....or some similar such nugget).

    Another "puzzle piece": the customer is using two of our devices; one is RS485, and the other USB.  Both use the same core processor board, with very similar firmware (the core processing code is the same).  The RS485 device is exhibiting the "problem" (I put that in quotes because normally we don't analyze the noise floor like this).  The USB device is outputting the data at 1kHz, but does not exhibit the problem (according to the customer).

    I attached another picture, with additional information (a third "puzzle piece").  The customer is running the sensor at 640SPS, but sees a significant notch in the spectral plot at 60 Hz and the 3rd harmonic (180Hz). This is very strange to me, because they should not be seeing an attenuation in this range, because the 60Hz filter is not applied above 20SPS. The customer is operating the RS485 unit via a 12V battery by the way, and the USB device is powered by the USB port of a computer.  

    By the way, both of these devices have been on the market for a while.  On of them since 2012.  With no changes basically.  The last firmware update was in 2013.  The application has not been touched in 3 years.  We have never had an inquiry like this in the past.

    It would be very difficult to get the raw data at this point, because the customer has the unit, unless I replicated the issue with a similar sensor at my facility.

    Thanks for your help!

  • Hi Scott,

    Looking at the peak-to-peak amplitudes between the RS485 and the USB plots it appears that the USB is actually noisier. For the spectral plot I see power peaks twice as high in the USB as compared to the RS485. It is possible that the same effect is in both but is lost in the noise. In the time domain plots I see something similar where the noise appears to be twice as large in the USB device as the RS485.

    In general, noise can be picked up as EMI/RFI but can also be associated with the power circuit on the PCB as well as inadequate grounding. Aliasing of high frequency content can be a problem. The actual sampling rate (or the rate the input is sampled) of the ADS1247 is the rate of the modulator which is converted to a 1's density bit stream. The data output rate is a decimated value of the modulated output. The primary method for calculating the analog input filtering relates to the modulator rate which is 256kHz for the 640sps output data rate. A secondary and very aggressive method would be to filter relative to the 640sps sample rate.

    Shorting the inputs together (within the proper common-mode for the PGA like AVDD/2) is a good starting point to determine whether the noise pattern seen is related to the analog input or if there is some other source (reference, analog power source, ground, etc.).

    Best regards,
    Bob B
  • The noise is greater in the USB sensor for 2 reasons... the first is that the sampling rate is 1kSPS for the USB and 640SPS for the RS485 so the USB has lower ENOBs. The second reason is that on the USB, the resolution of the ADC is spread over a broader (by 2/3) process units range, yet the signal we are looking for is the same magnitude, so the noise is going to be higher in the USB unit. Sorry I didn't share this earlier, but didn't think it very important at the time.

    Shorting the input is a good test, but the unit is with the customer, and in a welded metal container, so impossible to do right now.

    The filtering you are speaking of is capacitive (xtoY or similar) filtering on the input signal of the ADC?

    Are you saying that there is a possibility that this pattern is caused by aliasing? Can you please explain (technically) why we would see a repeating pattern, and with 1-2 random data points between? I.e. how aliasing can cause this?
  • Hi Scott,

    A colleague made it more clear to me in the initial graph regarding the pattern. Every 4 or 5 samples repeat the previous 4 or 5, so it is like every other set of data points are repeated. For example, ABCD, ABCD, DEFG, DEFG, etc.. I was gearing in on just the first ones marked and not looking at the specific pattern. I was perhaps drawing the wrong conclusions. This would seem more like a communication error, or a data manipulation error as opposed to an ADC error.

    I really don't know how to narrow this down in a sealed system. Does the total number of points coincide with the time of collection? Is there a way to monitor incoming data with some kind of analysis tool to intercept the communication? There is like 5 points and 4 of them repeat, or something like that. Is there some form of averaging or data in an array that may not be updating properly?

    Best regards,
    Bob B
  • Scott,


    Looking at the output data from the first post, Bob and I think this looks like some sort of data transfer error that is not a part of the ADC. In the first plot, it looks like there is a read of 5 data points which is followed by the same 5 data points. This seems to repeat through the entire data collection with one exception, where there's a sequence of 6 data points followed by the same 6 points in the middle of the plot. It could be some sort of bad array manipulation of the data.

    If you look at the spectral data from the RS485 case, the spectrum about DC repeats ~125Hz and ~250Hz. I believe that this is because the repeated data every 5 points from the 640SPS.

    Spectral content aside, this really looks like a data formatting error to me.


    Joseph Wu
  • Thanks Bob and Joseph.  As I said, I can't test this immediately, so I will go ahead and mark this as resolved. I really appreciate your timely advice!

    Scott