This thread has been locked.

If you have a related question, please click the "Ask a related question" button in the top right corner. The newly created question will be automatically linked to this question.

ADS1248: Raw Value Error: Convert to Temperature & Registers values shifting for constant temperature environment.

Part Number: ADS1248
Other Parts Discussed in Thread: ADS1220

Dear All, 

ADS1248 (with PT100) is being interfaced with Atmega Device. Software SPI has been used. 

The configuration registers are written and read back to confirm the working SPI and correct settings. 

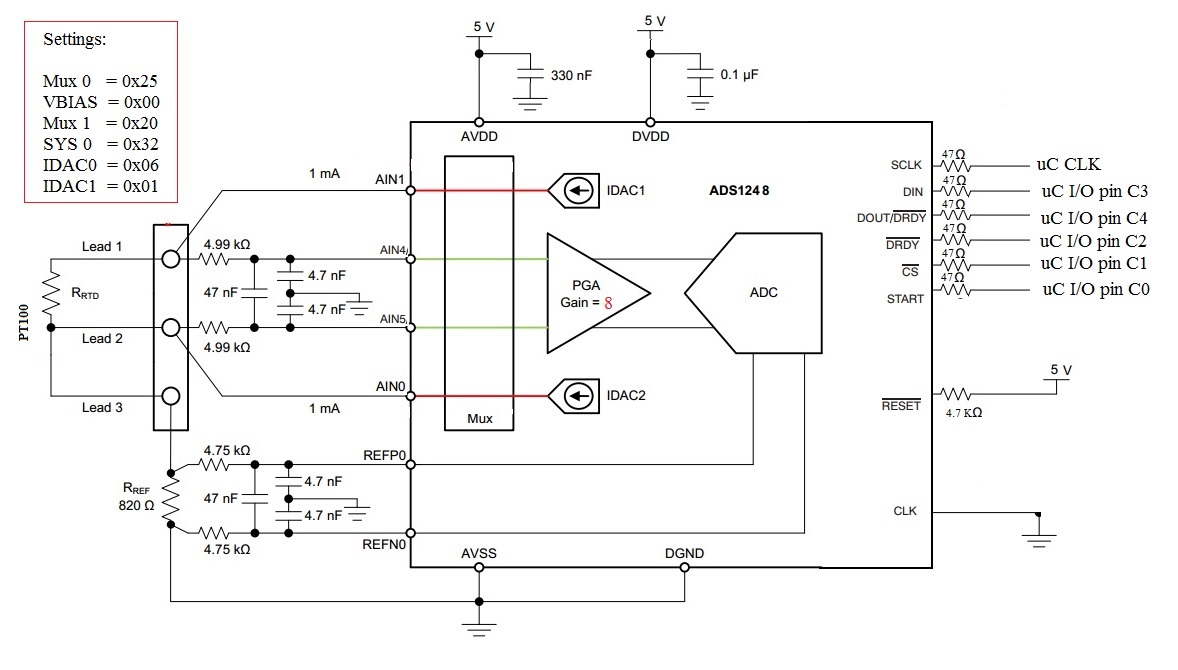
Settings: Mux0=0x25 VBIAS=0x00 MUX1=0x20, SYS0=0x22, IDAC0=0x04, IDAC1=0x01, 

i.e. Gain = 4, Data Rate = 20 SPS, Current IDAC= 100uA

The received value of registers are individually read from the ADC IC and 2's complement value has been taken care of for individual received bytes. 

The final count is received by: (Reg1x65536)+(Reg2x256)+(Reg3)

Q1 The value of the final count is shifting a lot even for fixed temperature value( Kindly see the attached picture)  

The leftmost value is manually saved temperature value, avgCount is average of 10 values(min & max removed from average), 

CalcValue is current last read value and its register are saved as Reg1, Reg2, Reg3. 

Q2: How to convert this value to temperature? 

       I have read few solutions for lookup table to avoid the complex calculation at microcontroller end. 

       But do i have to calibrate the lookup table value by myself? or is there any equation is involved? 


  • Dinesh,


    I don't know if you've seen this but this is an RTD application note that can be used to help set up RTD measurements. A link for it can be found below:

    www.ti.com/.../sbaa275.pdf

    In this app note, the ADC is measuring the RTD with a ratiometric measurement, so the ADC output value will give a ratio between the RTD resistance and the reference resistance value. Generally this ratiometric measurement will be low in noise if set up correctly. The reference resistance should be a precision resistor with low drift, or the measurement will be subject to the same error. If you are making a different type of measurement, this might be the problem.

    Going back to your questions:

    1. There does seem to be a lot of noise associated with your measurement. Post back with a schematic of how you are making the measurement, what #-wire measurement you are doing, and what calculations you might be making to setup this measurement. You can use the app note as a guide for answering these questions.

    2. The app note can guide you to converting the ADC measurement to a resistance, but converting the resistance to a temperature is a bit more complicated. Generally, I'll point people to the equations for converting resistance to temperature. At this point start with getting a stable measurement.


    Joseph Wu
  • Joseph, 

    Thank you for prompt response. 

    I got the part how to use standard lookup table instead of solving cubic/quadratic equation at microcontroller end. 

    The value of the code is reverse calculated.

    For 22 Degrees, the resistance value should be 108.57, and using the equation, the outcode should be around 4442688. 

    I have changed the CM filter parts values as per standard circuit given in application note SBAA330. 

    I already shared the register settings. I changed the current to 1ma in Register setting. Getting correct 1.6 volts across R reference. 

    But the problem of shifting the data still persists. 

    What could be the problem? 

    Sharing the .txt file of the data( kindly see above post for order of data). Single measurement is 89 bytes, in one line. Data is continuous. 

    TEMPDATA.TXT

  • Joseph,

    Update on the circuit:

    I have made a new circuit and the readings are still varying.

    I used the formula to get the resistance value for lookup table(gain=4)

    The file is attached for reference. Its a comma separated value and CR at end of single line.

    The last value is calculated resistance value.

    Q1: There is still difference between actual temp and calculated temp value.

    Should i used OFC or FSC registers to meet the gap.

    Q2: The  difference of temperature(actual Vs Calc) is not linear.

    Can you suggest where to make changes to improve the performance.

    Regards,

    newcircuit.TXT

  • Dinesh,

    I've had a chance to look at the data that you've sent and put it into an excel spreadsheet (Next time, it would be helpful to put the data into some easily usable format like excel). Also, I really need more information from you. I don't know how you have this measurement set up, what the device configuration is, what type of RTD you are using, and I really need a schematic.

    For the TEMPDATA file, it the output looks like this:

    This looks like some sort of settling to me. My first guess is that this is settling from the reference resistor. What type of reference resistor are you using (accuracy/drift)? Any error from the reference resistor reflects the error back into the ADC measurement.

    For the second newcircuit data, you get this:

    I'm not sure what is happening here, but it looks like something is turned on and off. In the intermediate measurements, this also looks like there is some settling going on the measurement.

    Again if this is some sort of settling in measurement, I'd really need the schematic. At this point, I don't know what calculations you're using or even anything about your setup. Also, can you give a description of the data that you send. It looks like a set temperature first, then some min/max ADC readings, some other numbers, and then an averaged(?) ADC result and then the calculated temperature.

    Going to your questions:

    1. I can help you get a more accurate measurement, but I can only do it through the electrical portion of it. Instead of calibrating it with a temperature measurement start by using a precision resistor. Use a 0.01% or 0.001% resistor and use that instead of an RTD. I've made many measurements with this method and I can get good results this way..

    2. If the measurement is non-linear, I would a set of precision resistors. Use several values spaced within the range of operation you expect. In any of these application notes or designs that we show, we use precision resistors, calibrate the value, and take the measurements. I've done this for substituting a PT100 with resistors from 20 to 400 Ohms.

    Again, I would get some precision resistors and make some measurements and skip the RTD for now. 

    Joseph Wu

  • Joseph, 

    Kindly find the attached excel file as discussed. 

    The Left most column is the temperature i am reading from off the shelf available third party temperature meter. 

    In my program i have provision to enter and save this manually entered data to text file. 

    Other columns are self explanatory. The circuit is also attached for your reference. 

    Still the accuracy & repeatability are not achieved. 

    1650_DegreeData.xlsx

    22_50_DegreeData.xlsx

  • Dinesh,


    I don't see anything wrong using this schematic. However there are a couple of things to note in the construction of this circuit. What type of resistor is RREF? I asked this in my last post, because the accuracy is directly related to the accuracy of this resistor. If this resistor drifts, then the system measurement will drift as well. This resistor should be something like a 0.01% accuracy and 5ppm/C drift type of resistor. Additionally, the IDAC current mismatch may also appear as a gain error because IDAC1 drives the RTD and IDAC1+IDAC2 drives the reference resistor. You can remove this error through chopping or swapping the IDAC current sources.

    Are there any other devices connected to the RTD lead connections? Any leakages from a multiplexer or protection diode will also create an error in the measurement.

    Looking at the excel files, I think I see what you're doing now. Column A is the reading from a temperature meter. Column B is the ADC average of 8 readings. Column C and D are the min and max from a set of 10 readings, where I think you remove the min and max to get the 8 that you average. The next four columns are the calculation that you use to get the 24 bit data (which you don't need to really show). Column I is the calculation of the resistance based on column B.

    Now, I'm not sure how you calculate the temperature, but the ADC reading looks a little low. With 16.2°C, I would guess that the RTD would be about 106.3Ω. In your RTD measurement there is some strange change over time, but the values all seem a bit low. With the 22.5°C reading I would expect an RTD resistance of about 108.8Ω and again it appears a bit low. Also, in that set of data, there are a few readings that appear abnormally high. At this point, I'm not sure what that is. It might be a communication error, but that would have given some larger min/max changes.

    With this data, the two temperatures you use are too close together to determine if this is a gain error or offset in the measurement. I would guess this is a gain error caused by the IDAC mismatch, but I can't be sure. You can try doing the chopping of IDAC currents to see if it helps. As for the strange behavior in the 22_50 data, I'm not sure what that is yet.

    However, as I mentioned in a previous post, I think you should start with measuring precision resistors and seeing what error you get. Using precision resistors you can set up the ADC measurement. Then you can also take voltage measurements across the precision resistor and the reference resistor with a precision multimeter. This way you can directly compare the ADC measurement with the multimeter results. I've used this method to determine the source of errors in other ADC measurements.


    Joseph Wu
  • Dinesh,


    DId you have anything to add to your questions? I think you should make some measurements with a variety of precision resistor to see if you can track down the gain error and drift that you've seen.

    I'll close this post for now, but if you have further questions, just post back and we can continue debugging your circuit.


    Joseph Wu
  • Joseph, 

    I have tried the experiment with precision resistors. Kindly find the attached file for 100 Ohm resistor. The values are bit better but still varies. 

    Configuration registers are: 

    Mux0=0x25, Vbias=0x00, Mux1=0x20 ,Sys0=0x32 IDAC0=0x06 IDAC1=0x01

    Please find the attached file for 100 Ohm Resistor. 

    1220_300319_TEMPDATA.TXT

    I tried the experiment with ADS1220 as well. Thought that i am missing some setting in ads1248, better to use single channel device. 

    However the problem still persist. Find the attached file for same. The settings used for Configuration registers are: 

    Conf 1 = 0x04, Conf 2 = 0x00, Conf 3= 0x46, Conf4=0x70. 

    Files are as per previous discussions format, with minor changes, you can figure it out easily by looking at the data. 

    I have changed the values of CMRR resistors/capacitors as well and some improvement was observed. 

    1248_300319_TEMPDATA.TXT

    Regards, 

  • Joseph,

    Adding more data for analysis. Ads1248 is used for this experiment with following configuration.

    Mux0=0x25, Vbias=0x00, Mux1=0x20 ,Sys0=0x32 IDAC0=0x06 IDAC1=0x01

    The 100 Ohm fix value resistance used instead  of PT100 sensor.

    I have saved timestamp as well. Data starts at 06:14 PM to 08:56 AM. Almost 15 hours of data.

    The graph of current outputValue,  calculated RTD and temperature(from LookUpTable) is also attached.

    Observations:

    1. The graph of OutPut Value is continuous gradual increase. But the RTD value data has sudden dip around 08:54 PM to 11:06 PM.

    2. The Temp data is discrete, because of discrete look up table based values. Still the Glitch of 08:54-11:06 is reflected in this data as well.

    3. After 11:06, data is consistent(minute gradual increase). RTD change is 0.3 ohms, change in Output Value = 3796, temp change = 0.7 Degrees

    Possible Solution:

    1. Remove calculation error error in RTD values.

    2. Improve averaging.

    Kindly share your analysis and improvement pointers which can remove th still visible gradual increase of OutputValue.

    Regards,

    ads1248.txt

  • Dinesh,

    I'm out of the office right now, but I did have a quick chance to look over some of your data. First, I had a few problems with viewing it at first, because it's not really a text file. However, I was able to import it directly into excel, with some definition in the delimiting character.

    I'm not sure of the organization of this data, based on previous data it looks as if column A is the temp sensor interpolated data, while column E is the ADC data. However, if you were using precision resistors, you shouldn't have much variation at all. This is as if you were using the precision reference resistor, but still using the RTD.

    However, do see something that might be a problem. I'll just use the ADS1248 data to start. Here is the plot of column A data:

    It does look like it has some spikes, but it doesn't seem discontinuous. There is definitely some movement over time. However, this is what the correlating data from column E:

    This looks far more discontinuous. It looks as if the data as large jumps from one to the next sample. These problems look more like a communication issue. There are jumps of several thousand codes from one sample to the next.

    Are you using read data continous mode, or are you using an SDATAC command (stop read data continuous) and then issuing an RDATA command to get the data. If you use read data continuous mode, then once the /DRDY falls, you have until the next /DRDY event to read the data or new data will interrupt the data read, restarting the DOUT register.

    If you aren't doing so, I would send the SDATAC command, and use RDATA to read each data and see if the noise doesn't clear up.

    The ADS1220 data that you provide, looks significantly better, but if you look closely at the data, you'll see at a similar discontinuous jump in the data in the first ten data points. As I mentioned in a previous post, you shouldn't have to average points to get something closer for good data.

    Again, I'm out of the office right now, it may take extra time to get responses back.

    Joseph Wu

  • Joseph,

    Replying to your recent updates on the post, i am not using continuous mode. I am using DRDY event to read the data.
    Though I am using averaging, but only 10 values, out of that removing minimum and maximum values.

    Before your update, I just posted another set of 15 hours of data for 1248. Probably, better for further analysis.
    The data in graph is , top most graph is Output Value, graph in middle is of RTD value, bottom graph is of Temp value.

    About the initial data of any data set in this discussion, be it todays update or 30th march data. The initial values are not stable, after some time it attains better stability. How to remove this initial data glitch? Could it be because of CMRR filter component values?

    Regards,
  • Hi Dinesh,

    I'm going to cover this question moving forward as Joseph has been reassigned to support some other devices. Is it possible for you to send an actual schematic instead of the block diagram? In particular I need to see how you have connected REFOUT/REFCOM and the cap loading. I think that some of the initial settling you are seeing may be related to self-heating of the 100 Ohm resistor you are using (and perhaps the reference resistor as well). Can you give me part numbers for these 2 resistors being used?

    Many things can be hidden with averaging. It would be best to see raw data (output codes from the ADC) without any manipulation of the data by making conversions or averaging.

    Best regards,
    Bob B
  • Sir, 

    Thank you for the follow up. I can send the schematic, but as i have told you many times, due to confidential reasons i cannot share the exact circuit. Kindly provide mail support or contact details so that i can send the schematic. Everything cannot be discussed publicly. In this regard, i have found really poor support from Texas instruments team. 

    And yes, your observation is may be correct, the initial settling is due to self heating may be. I have collected data for more than 12 hours for further analysis.May be that can be of more help. 

    The averaging does hide a lot of things, i knew that beforehand, hence, always provided the first raw data in that particular average cycle of 10 samples. The data is available in the above text/csv files. 

    Again, its my request to continue the support on mail. I will be happy to share the findings with the forum, once the issue is resolved. Provide your contact details. 

    Regards, 
    Dinesh Kumar

  • Hi Dinesh,

    I need to see all the raw data as successive contiguous data, not just the first in a group of averages.  In many cases you should not be required to do additional averaging beyond the FIR filter within the ADS1248.  Also, the averaging algorithm may have computational error, so we really need to know a few of things.  First, is there a particular noise source that is affecting the conversion.  Second, is there a communication error that we can detect. And third, we can always post process the raw data after it is collected to see the benefit in averaging and if there is one method of averaging that may be better than another.

    There are two ways you can connect to me directly to send me your schematic.  One method is to click on my name/picture and then start a conversation that will be private.  Another method is to email me:

    mailto:pa_deltasigma_apps@ti.com

    Best regards,

    Bob B