This thread has been locked.

If you have a related question, please click the "Ask a related question" button in the top right corner. The newly created question will be automatically linked to this question.

ADS5562EVM: Low SFDR

Part Number: ADS5562EVM
Other Parts Discussed in Thread: SN74AVC16827

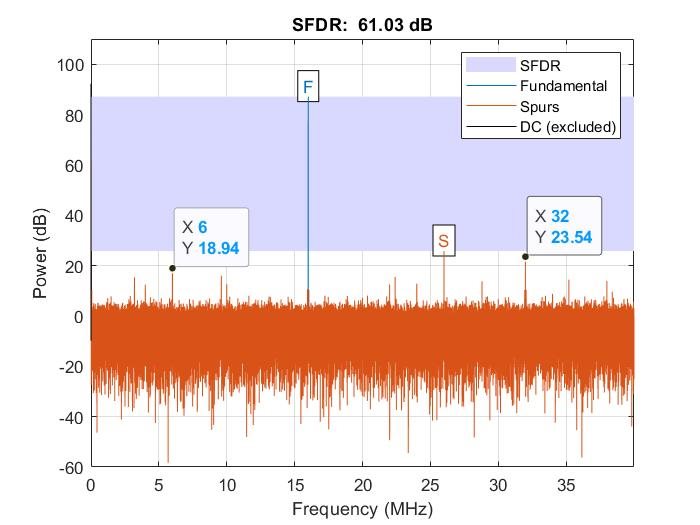
The measured SFDR is 48dBc as compared to 84dBc expected from the datasheet due to harmonic spurs. The input sine wave frequency of 16MHz and the clock frequency of 80MHz were applied to ADS5562EVM board with added LVDStoCMOS converter on U15. The measured SFDR plot is attached.

  • We are taking a look at this and will get back to you asap. 

    Yusuf

  • I haven't heard back since submitting this case. Should I expect to heard back or have this case resolved?

  • Hi AlB,

    Sorry for the delay.

    1. The noise floor in the FFT plot you sent is wavy (it is expected to be flat). Is it that way only when you send an input signal? Can you send a plot with input 0V differential input signal?

    2. What's the amplitude of input signal that you apply to the input? I see that the FFT plot is amplitude is not normalized to 0 dBFS.

    3. "with added LVDStoCMOS converter on U15" -- There's no U15 on this EVM. Can you please clarify?

    Regards,

    Vijay

  • Hi Vijay,

    1. Please find the fft plot below with 0V differential input signal.


    2. The input to differential signal is a 3.4Vpp sine wave at 16MHz. Please find the update plot below. As shown, a lot of spurs are present in the Nyquist band. These spurs need to be removed to match the datasheet plot.

    3. SN74AVC16827 is added to U15 on the eval board which converts LVDS output to CMOS voltage. Please refer to the latest schematic of eval board for the details.

    Regards,

    Albert

  • Hi Albert,

    In your FFT plots, when you compare 'no signal' condition to 'with input' condition, the noise floor increased by ~20 dB. This is not expected. From datasheet plots in section 6.15.1, we can see that noise floor remains almost the same from small signal condition to -1dBFs input signal. 

    1. Can you look at the time domain data and make sure that signal is not saturating the ADC?

    2. Are you using the fine gain option? If yes, you can saturate the ADC with 3.4V p-p signal.

    3. Can you increase the input signal level slowly and see when the noise floor is going bad? if it is gradual or sudden

    I have ordered an EVM from central repository to test this in my lab. I should receive it by Monday. I will test and get back to you with results then.

    Regards,

    Vijay

  • Hi Vijay,

    1. The signal is not saturated as I checked by gradually increasing the input amplitude.

    2. I am not using fine gain and set to default after reset satisfying the <3.58Vpp for 1dB gain input.

    3. The noise floor gradually grows with increasing input amplitude.

    Were you able to replicate the plot in the datasheet?

    Regards,

    AlB

  • Hi Albert,

    Thanks for the tests.

    I will receive the EVM tomorrow. I'll set it up and try to replicate the DS plot. Will update you as soon as I can. 

    Regards,

    Vijay

  • Hi Albert,

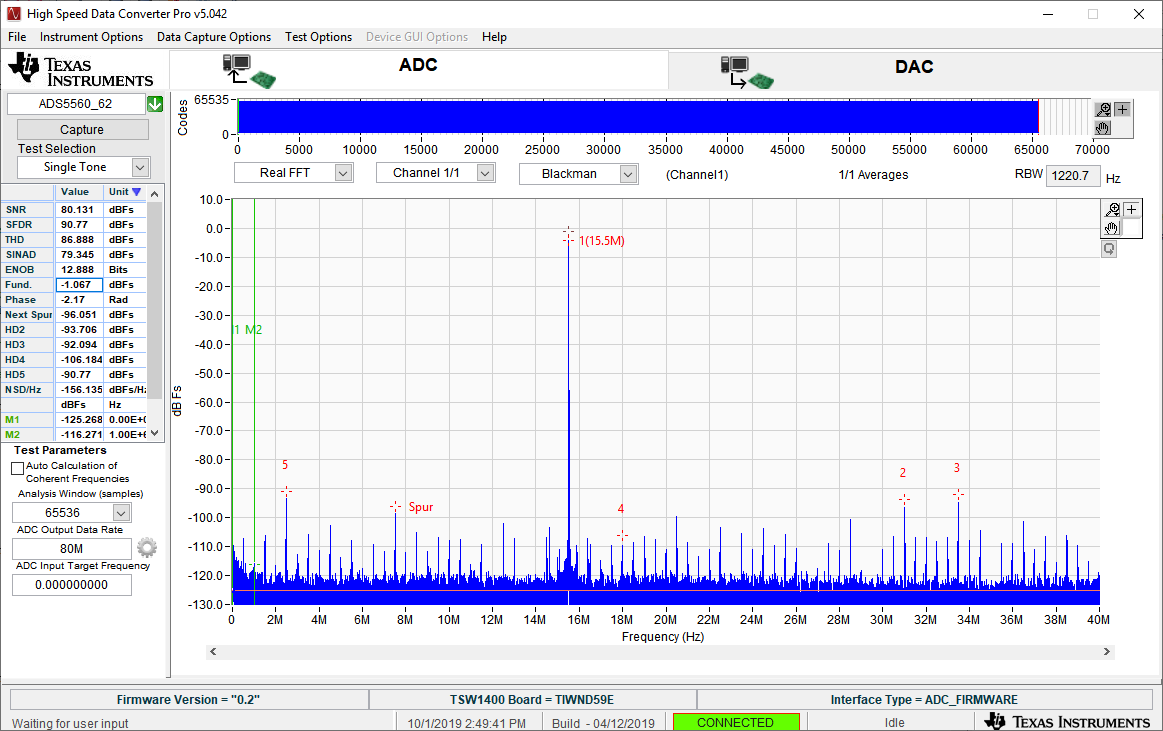
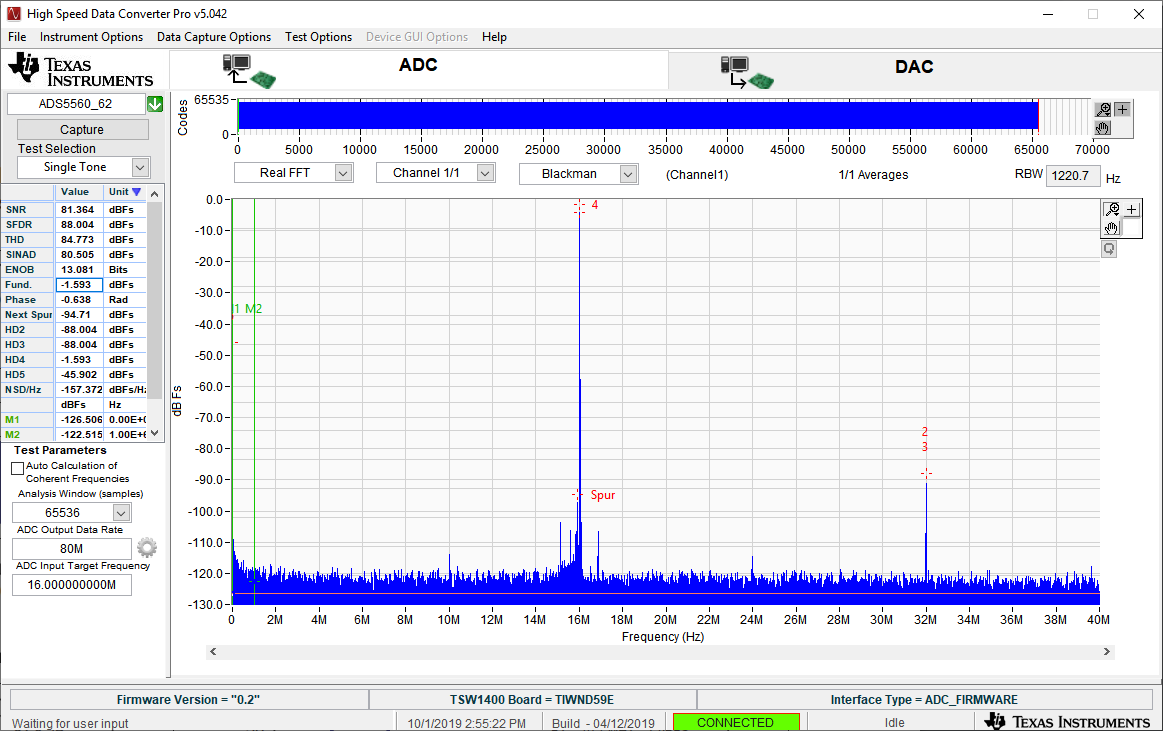
    I was able to replicate the datasheet level performance on my bench. See below plots:

    1) 80 MHz clock and 15.5 MHz input 

    2) 80 Mhz clock and 16 MHz input.

    I don't have a 16 MHz bandpass filter. Nearest center frequency bandpass filter I have is 15.5 MHz. So I used it for both the above plots. I used 2 SMA100A signal generators for clock and signal inputs. 

    I suspect that performance on your setup might be limited by quality of clock or input signals. I suggest you to try with bandpass filters.

    Regards,

    Vijay

  • Hi Vijay,

    Thank you for providing the plot. Can you share the details of the setup you used? What type of bandpass filter did you use for your measurement? How did you acquire the digital bits? Was the eval board tested on the testbench or enclosed or on ATE?

    Regards,

    Albert

  • Vijay,

    Also, what were the settings on the eval board you tested on? Did you add the LVDS to CMOS converter at the output as I have? What is the input signal amplitude?

    Regards,

    Albert

  • Hi Albert,

    This test was done with eval board on test bench. I used the TSW1400EVM for data capture. 

    Two SMA100A signal generators were used for clock and input tone generation. I used a TTE bandpass filter (part number: kc4t-15.5m-775k-50) for input tone. read more about filter specs at: 

    The purpose of the filter is to suppress the harmonics from signal generator. I haven't used a filter on the clock input. As you see degradation of SNR with increasing input amplitude, cause for this can be noise on clock input. 

    I used the eval board in default settings. I have not added the LVDS to CMOS converter (U15). But as this in digital domain, it should not affect the performance. Input amplitude for 15.5 MHz frequency was about 15dBm. For the 16MHz case, the input amplitude from source was much higher as filter center frequency was 15.5 MHz.

    Regards,

    Vijay