This thread has been locked.

If you have a related question, please click the "Ask a related question" button in the top right corner. The newly created question will be automatically linked to this question.

ENOB calculate question

Other Parts Discussed in Thread: ADC12DJ5200RF

Hello everyone,

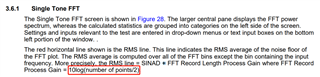
I have a question, while getting ENOB, I find that the formula like this (below picture from "High-Speed Data Converter Pro GUI User's Guide"), why need plus "Fundamental Power", I don't understand.

Thank you!

  • Hi Nan,

    Good catch, I am not sure why the Fundamental Power is there in the equation. We are in the middle of updating the HSDC Pro user guide and will have this updated.

    ENOB = (SINAD-1.76)/6.02, assuming the SINAD value captured has an analog input signal at or near full-scale of the ADC.

    The assuming in this equation here is that, one may take do an ENOB calculation with the input signal backed off. That might be what the "fundamental power" is reverencing.

    Regards,

    Rob

  • Hi Rob,

    Thanks for your reply, but I don't get what you say "one may take do an ENOB calculation with the input signal backed off", which is meaning that I can caculate ENOB without knowing the input signal ? I don't understand this.

    Regard,

    Nan  

  • Hi Nan,

    Sorry for the confusion. You can do ENOB measurements with the fundamental frequency at different levels. for example, -1dBFS, -3dBFS, -6dBFS, etc.

    Typically ENOB is captured at near fullscale or -1dBFS.

    Regards,

    Rob

  • Hi Rob,

    Thank you, I think you mean that ENOB will change if the input signal scale is not near fullscale, and I find something like this:

    where Vfs is fullscale input, 2*A is the actual input scale. Is it right?

    Regards,

    Nan

  • Hi Nan,

    Yes, that looks correct, you can do a quick check of the eqn running HSDC pro at the different amplitude levels to check.

    I can look at this tomorrow in the lab if you don't have time.

    Thx,

    Rob

  • Hi Rob,

    Thank you very much, I'm not in lab recently.

    Regards,

    Nan

  • Hi Rob,

    I meet another detailed problem when I compare two FFT picture(one from HSDC FFT, one from python), 

    1) a bit difference around DC(picture 1)

    2) there is one extra strange point in the end of HSDC FFT picture(picture 2), because there are 65536 points totally, so in first Nyquist area it should appear half of this number points, ie 32768 points,  but appear 32769. I don't know why?

    Regards,

    Nan

  • Hi Nan,

    I believe these are artifacts of the windowing that you are using. 

    It is possible you coherently sample instead and use the rectangular windowing?

    Thanks,

    Rob

  • Hi Rob,

    Thank you for your reply, I don't sample coherently but I add "hanning" window as HSDC does, but there is an strange extra point.

    Except that point and around DC part like picture 1 I have showed before, other place is good fit with python FFT result.

    Thank you again,

    Nan

  • Hi Nan,

    In HSDCpro we notch( remove) some of the bin from the FFT for calculation of various ac parameters such SNR SFDR SNIAD. The bin which is reomove from the FFT is displaced in gray color and when we displace the gray color bins on top of the FFT some of points don't line up and hence you see the artifacts in FFT. Please note these artifacts are only in the FFT plot these for display purposes only. The calculation are not affected by these artifacts. 

    Regards,

    Neeraj

  • Hi Neeraj,

    May I realize this question as autually the last point does not count when HSDC caculate SINAD or ENOB?

    Thank you,

    Nan

  • Hi Rob, 

    After FFT, there is a red line in the figure 1 below, and I find that it's the RMS value of the noise floor.

    In HSDC User's Guide, it shows that this value can be caculated by formula like figure 2 shows.

    My question is when my sample points is 65536, the RMS value is about 40 dBFs by this formula, but why figure 1 shows the value is about -90dBFs ?

    Thank you,

    Nan

  • Hi Nan,

    Your noise floor and they source you are using for either the analog input signal and/or clock is way too high. Too noisy. So the -90 RMS noise floor calculation is correct and so is the -90dB red line.

    Regards,

    Rob

  • Hi Nan,

    Yes, that is correct.

    Regards,

    Rob

  • Hi Rob,

    Sorry, I mistook one part of the formula, I still have one question.

    The SINAD value is about 40 dBFs, FFT record process gain is about 45 dBFs, so red line value is about 85 dBFs, not larger than 90 dBFs, but if I use SNR value, about 45 dBFs, to get red line value, it's a good result like figure 1 shows.

    Also, "the number of points" in figure 2 formula shows, does it mean the total number of samples or the points number after FFT?

    Thank you, 

    Nan

  • Hi Nan,

    I am not sure I am following. The formula to achieve the redline is as follows:

    SNRFS + FFT Process Gain

    FFT Process Gain (per BIN) = 10*log (M/2) = 45.15dB, M = Number of FFT points = 65536.

    This means your SNR is way off due to either the signal source of the clock and/or the analog input signal source. I believe you were evaluating the ADC12DJ5200RF. If so, then your SNR should be around 54-56dBFS @-1dBFS at or below 1000MHz Fin, Fs = 5.2GSPS.

    My assumption is that both of your signal sources that are being used are not of low enough in noise (ie - jitter/phase noise).

    Also, it is always recommended to filter the out of he signal generator. This will help reduce the wideband noise coming from the signal source and reduce the spurious content from the signal sources as well.

    Regards,

    Rob

  • Hi Rob,

    Sorry for being a bit messy, but I feel I get what I want.

    Thank you very much!

    Nan

  • Welcome Nan!

  • Hi Rob,

    Oh, there is one remaining question I am not sure before,

    I don't get the accurate ENOB result  as HSDC, and then I save the HSDC FFT data to test my python algorithm.Not particularly consistent, too.

    I have checked my algorithm many times, is it possible that there is a bit bias of calculation accuracy in python?

    My algorithm details are:
    1)get sinewave data and do FFT;
    2)considering notch frequencies(include DC as HSDC does), get 5 points around signal-frequency as the input signal and get their sum power value. Other points are noise floor, finally I caculate the signal to noise ratio, getting SINAD with formula. 
    3)considering the gain term because the input signal amplitude is not near the full-scale value, get ENOB with formula.

    4)compare reault:

    Thank you,

    Nan

  • Hi Nan,

    There will always be some slight variation from data capture to data capture, please consider that as well. So this comparison looks equivalent to me.

    What would be good is to try is a very low signal amplitude and mid-range signal amplitude and high, almost near fullscale, signal amplitude and compare the differences.

    Next, I would do the same with frequency, use a low, medium and high frequency and check.

    Hope this helps.

    Regards,

    Rob