This thread has been locked.

If you have a related question, please click the "Ask a related question" button in the top right corner. The newly created question will be automatically linked to this question.

Unable to resolve error "Error connecting to the target: (Error -1135 @ 0x0)"

Other Parts Discussed in Thread: CCSTUDIO, TMS320F28035, CONTROLSUITE

Hi,


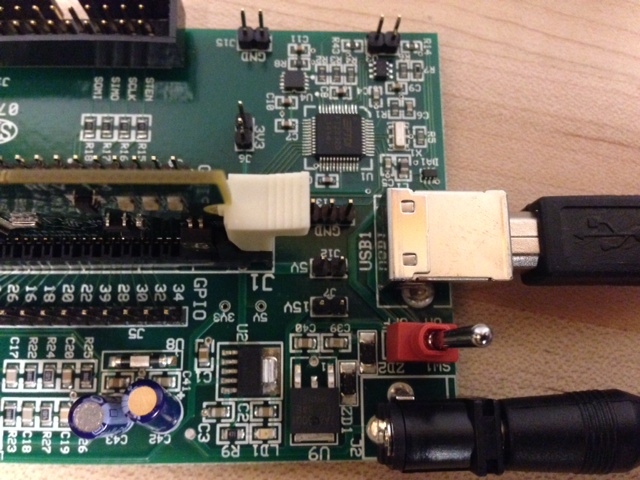
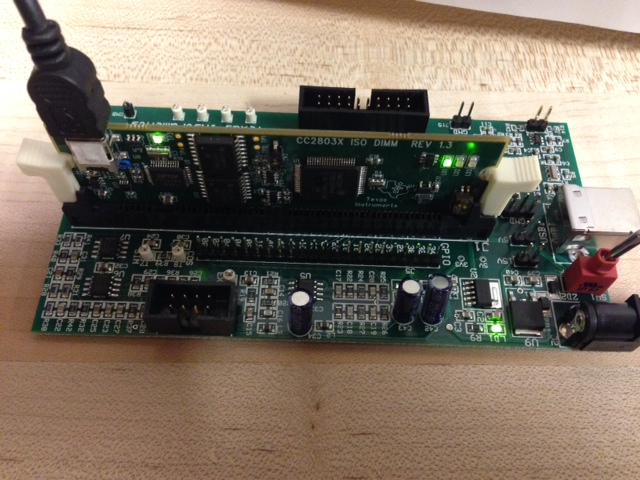
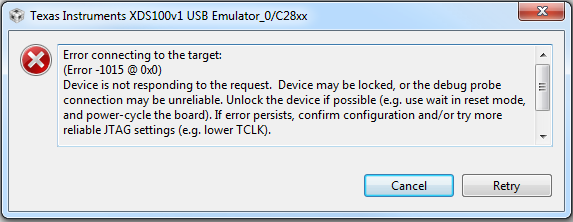
I'm using the TI resolver kit. I'm trying to run Resolver-DevInit_F2803x.c. When I click on the debug button in 5v5 a receive the following error. 

Error connecting to the target:
(Error -1135 @ 0x0)
The debug probe reported an error. Confirm debug probe configuration and connections, reset the debug probe, and retry the operation.
(Emulation package 6.0.14.5)

Also when I do a Test Connection, I receive the following "failed" message

[Start]

Execute the command:

%ccs_base%/common/uscif/dbgjtag -f %boarddatafile% -rv -o -F inform,logfile=yes -S pathlength -S integrity

[Result]


-----[Print the board config pathname(s)]------------------------------------

C:\Users\jamesjmc\AppData\Local\.TI\693494126\
    0\0\BrdDat\testBoard.dat

-----[Print the reset-command software log-file]-----------------------------

This utility has selected a 100- or 510-class product.
This utility will load the adapter 'jioserdesusb.dll'.
The library build date was 'Sep  4 2015'.
The library build time was '21:59:23'.
The library package version is '6.0.14.5'.
The library component version is '35.35.0.0'.
The controller does not use a programmable FPGA.
The controller has a version number of '4' (0x00000004).
The controller has an insertion length of '0' (0x00000000).
This utility will attempt to reset the controller.
This utility has successfully reset the controller.

-----[Print the reset-command hardware log-file]-----------------------------

The scan-path will be reset by toggling the JTAG TRST signal.
The controller is the FTDI FT2232 with USB interface.
The link from controller to target is direct (without cable).
The software is configured for FTDI FT2232 features.
The controller cannot monitor the value on the EMU[0] pin.
The controller cannot monitor the value on the EMU[1] pin.
The controller cannot control the timing on output pins.
The controller cannot control the timing on input pins.
The scan-path link-delay has been set to exactly '0' (0x0000).

-----[The log-file for the JTAG TCLK output generated from the PLL]----------

There is no hardware for programming the JTAG TCLK frequency.

-----[Measure the source and frequency of the final JTAG TCLKR input]--------

There is no hardware for measuring the JTAG TCLK frequency.

-----[Perform the standard path-length test on the JTAG IR and DR]-----------

This path-length test uses blocks of 64 32-bit words.

The test for the JTAG IR instruction path-length failed.
The JTAG IR instruction scan-path is stuck-at-ones.

The test for the JTAG DR bypass path-length failed.
The JTAG DR bypass scan-path is stuck-at-ones.

-----[Perform the Integrity scan-test on the JTAG IR]------------------------

This test will use blocks of 64 32-bit words.
This test will be applied just once.

Do a test using 0xFFFFFFFF.
Scan tests: 1, skipped: 0, failed: 0
Do a test using 0x00000000.
Test 2 Word 0: scanned out 0x00000000 and scanned in 0xFFFFFFFF.
Test 2 Word 1: scanned out 0x00000000 and scanned in 0xFFFFFFFF.
Test 2 Word 2: scanned out 0x00000000 and scanned in 0xFFFFFFFF.
Test 2 Word 3: scanned out 0x00000000 and scanned in 0xFFFFFFFF.
Test 2 Word 4: scanned out 0x00000000 and scanned in 0xFFFFFFFF.
Test 2 Word 5: scanned out 0x00000000 and scanned in 0xFFFFFFFF.
Test 2 Word 6: scanned out 0x00000000 and scanned in 0xFFFFFFFF.
Test 2 Word 7: scanned out 0x00000000 and scanned in 0xFFFFFFFF.
The details of the first 8 errors have been provided.
The utility will now report only the count of failed tests.
Scan tests: 2, skipped: 0, failed: 1
Do a test using 0xFE03E0E2.
Scan tests: 3, skipped: 0, failed: 2
Do a test using 0x01FC1F1D.
Scan tests: 4, skipped: 0, failed: 3
Do a test using 0x5533CCAA.
Scan tests: 5, skipped: 0, failed: 4
Do a test using 0xAACC3355.
Scan tests: 6, skipped: 0, failed: 5
Some of the values were corrupted - 83.3 percent.

The JTAG IR Integrity scan-test has failed.

-----[Perform the Integrity scan-test on the JTAG DR]------------------------

This test will use blocks of 64 32-bit words.
This test will be applied just once.

Do a test using 0xFFFFFFFF.
Scan tests: 1, skipped: 0, failed: 0
Do a test using 0x00000000.
Test 2 Word 0: scanned out 0x00000000 and scanned in 0xFFFFFFFF.
Test 2 Word 1: scanned out 0x00000000 and scanned in 0xFFFFFFFF.
Test 2 Word 2: scanned out 0x00000000 and scanned in 0xFFFFFFFF.
Test 2 Word 3: scanned out 0x00000000 and scanned in 0xFFFFFFFF.
Test 2 Word 4: scanned out 0x00000000 and scanned in 0xFFFFFFFF.
Test 2 Word 5: scanned out 0x00000000 and scanned in 0xFFFFFFFF.
Test 2 Word 6: scanned out 0x00000000 and scanned in 0xFFFFFFFF.
Test 2 Word 7: scanned out 0x00000000 and scanned in 0xFFFFFFFF.
The details of the first 8 errors have been provided.
The utility will now report only the count of failed tests.
Scan tests: 2, skipped: 0, failed: 1
Do a test using 0xFE03E0E2.
Scan tests: 3, skipped: 0, failed: 2
Do a test using 0x01FC1F1D.
Scan tests: 4, skipped: 0, failed: 3
Do a test using 0x5533CCAA.
Scan tests: 5, skipped: 0, failed: 4
Do a test using 0xAACC3355.
Scan tests: 6, skipped: 0, failed: 5
Some of the values were corrupted - 83.3 percent.

The JTAG DR Integrity scan-test has failed.

[End]


I've checked the following:

-The device shows up in Device manager, so it is connected.

-All voltages on the device are correct.

-All software is updated except for...

Hercules emulation

I get the following error when trying to install this...

Cannot complete the install because one or more required items could not be found.
  Software being installed: Hercules Emulation 6.0.6 (com.ti.ccstudio.hercules.win32.feature.group 6.0.6)
  Missing requirement: Hercules Emulation 6.0.6 (com.ti.ccstudio.hercules.win32.feature.group 6.0.6) requires 'com.ti.dsflash.win32.feature.group 6.0.0.766' but it could not be found

Help would be appreciated...Thanks

  • Hi,

    A brief update on the problem. I'm still having the same problem; however I installed the latest software....v6, and I continue to have the same issue.

    I am reading TMDSRSLVR - Resolver EVM (R2.0) Kit - How to Run Guide, and following these directions.

    For a Target Configuration it asks that the connection be "Texas Instruments XDS100v1 USB Emulator". I cannot find this connection choice. I think that this may be part of the problem. Again this problem occurs if I use V5 or V6. I cannot find this connection in either version

    Again...any help would be appreciated.

  • Hi James,

    You should be able to able to get this option. If not then you missed installing the respective drivers while installing CCS v6.

    Regards,

    Gautam

  • Gautam,


    I appreciate the response. However, my general setup looks like what you just posted. I can also get "Texas Instruments XDS100v1 USB Debug Probe" as an option. This option continues to give me errors as I described. It is also not the option the "TMDSRSLVR - Resolver EVM (R2.0) Kit - How to Run Guide" tells me to chose. On page 5 of this guide they specify the following (The picture below is from the guide rather than my setup):

    The guide is specifying the "Texas Instruments XDS100v1 USB Emulator". I can't find that choice, nor do I see that choice in your list from your screen shot.

    What am I missing? Why can't I see the "Texas Instruments XDS100v1 USB Emulator" option?


    Best,

    James

  • Below is the screen shot I meant to post:

  • I'm having trouble posting a screen capture like you did. What is the trick to this? I'll try one more time...

  • James,

    Unfortunately I don't have this development kit. Also, since the images did not go through, I am not sure what the guide says, but if it says XDS100v1, it does not match what is mentioned on the product description:

    If the description is correct, please select XDS100v2 instead.

    The difference between what the guide says ("Emulator") and Gautam's screenshot ("Debug Probe") is just cosmetic. It was a difference done in the latest releases of a CCS component designed to correct a misnomer originated almost two decades ago.

    Hope this helps,

    Rafael 

  • Gautam, Rafael ,

    Thanks for the responses. They were both helpful in moving this issue to be resolved. I still have the issue though, and I'm still seeing the same errors.

    I am able to see exactly what is in Gautum screen shot. Also, it is helpful to know that there is no difference between the XDS100v2 emulator and debug probe.

    Here is what I have now...

    The latest software is installed (Version: 6.1.0.00104 ).  When I go to help and check for updates, I get "No updates were found".....I already installed updates

    When check the device manager thru windows I see...

    Driver Provider: FTDI

    Driver Date: 3/18/2011

    Driver Version: 2.8.14.0

    I am still getting the same error when pushing the debug button. When I test connection with either the XDS100v2 or XDS100v1 debug proble I get the same failed readout.

    Please advise on additional steps to take to resolve this issue.

    The "Test connection" output:

    [Start: Texas Instruments XDS100v2 USB Debug Probe_0]

    Execute the command:

    %ccs_base%/common/uscif/dbgjtag -f %boarddatafile% -rv -o -F inform,logfile=yes -S pathlength -S integrity

    [Result]


    -----[Print the board config pathname(s)]------------------------------------

    C:\Users\jamesjmc\AppData\Local\TEXASI~1\
        CCS\ti\1\0\BrdDat\testBoard.dat

    -----[Print the reset-command software log-file]-----------------------------

    This utility has selected a 100- or 510-class product.
    This utility will load the adapter 'jioserdesusb.dll'.
    The library build date was 'Sep  4 2015'.
    The library build time was '21:59:23'.
    The library package version is '6.0.14.5'.
    The library component version is '35.35.0.0'.
    The controller does not use a programmable FPGA.
    The controller has a version number of '4' (0x00000004).
    The controller has an insertion length of '0' (0x00000000).
    This utility will attempt to reset the controller.
    This utility has successfully reset the controller.

    -----[Print the reset-command hardware log-file]-----------------------------

    The scan-path will be reset by toggling the JTAG TRST signal.
    The controller is the FTDI FT2232 with USB interface.
    The link from controller to target is direct (without cable).
    The software is configured for FTDI FT2232 features.
    The controller cannot monitor the value on the EMU[0] pin.
    The controller cannot monitor the value on the EMU[1] pin.
    The controller cannot control the timing on output pins.
    The controller cannot control the timing on input pins.
    The scan-path link-delay has been set to exactly '0' (0x0000).

    -----[The log-file for the JTAG TCLK output generated from the PLL]----------

    There is no hardware for programming the JTAG TCLK frequency.

    -----[Measure the source and frequency of the final JTAG TCLKR input]--------

    There is no hardware for measuring the JTAG TCLK frequency.

    -----[Perform the standard path-length test on the JTAG IR and DR]-----------

    This path-length test uses blocks of 64 32-bit words.

    The test for the JTAG IR instruction path-length failed.
    The JTAG IR instruction scan-path is stuck-at-ones.

    The test for the JTAG DR bypass path-length failed.
    The JTAG DR bypass scan-path is stuck-at-ones.

    -----[Perform the Integrity scan-test on the JTAG IR]------------------------

    This test will use blocks of 64 32-bit words.
    This test will be applied just once.

    Do a test using 0xFFFFFFFF.
    Scan tests: 1, skipped: 0, failed: 0
    Do a test using 0x00000000.
    Test 2 Word 0: scanned out 0x00000000 and scanned in 0xFFFFFFFF.
    Test 2 Word 1: scanned out 0x00000000 and scanned in 0xFFFFFFFF.
    Test 2 Word 2: scanned out 0x00000000 and scanned in 0xFFFFFFFF.
    Test 2 Word 3: scanned out 0x00000000 and scanned in 0xFFFFFFFF.
    Test 2 Word 4: scanned out 0x00000000 and scanned in 0xFFFFFFFF.
    Test 2 Word 5: scanned out 0x00000000 and scanned in 0xFFFFFFFF.
    Test 2 Word 6: scanned out 0x00000000 and scanned in 0xFFFFFFFF.
    Test 2 Word 7: scanned out 0x00000000 and scanned in 0xFFFFFFFF.
    The details of the first 8 errors have been provided.
    The utility will now report only the count of failed tests.
    Scan tests: 2, skipped: 0, failed: 1
    Do a test using 0xFE03E0E2.
    Scan tests: 3, skipped: 0, failed: 2
    Do a test using 0x01FC1F1D.
    Scan tests: 4, skipped: 0, failed: 3
    Do a test using 0x5533CCAA.
    Scan tests: 5, skipped: 0, failed: 4
    Do a test using 0xAACC3355.
    Scan tests: 6, skipped: 0, failed: 5
    Some of the values were corrupted - 83.3 percent.

    The JTAG IR Integrity scan-test has failed.

    -----[Perform the Integrity scan-test on the JTAG DR]------------------------

    This test will use blocks of 64 32-bit words.
    This test will be applied just once.

    Do a test using 0xFFFFFFFF.
    Scan tests: 1, skipped: 0, failed: 0
    Do a test using 0x00000000.
    Test 2 Word 0: scanned out 0x00000000 and scanned in 0xFFFFFFFF.
    Test 2 Word 1: scanned out 0x00000000 and scanned in 0xFFFFFFFF.
    Test 2 Word 2: scanned out 0x00000000 and scanned in 0xFFFFFFFF.
    Test 2 Word 3: scanned out 0x00000000 and scanned in 0xFFFFFFFF.
    Test 2 Word 4: scanned out 0x00000000 and scanned in 0xFFFFFFFF.
    Test 2 Word 5: scanned out 0x00000000 and scanned in 0xFFFFFFFF.
    Test 2 Word 6: scanned out 0x00000000 and scanned in 0xFFFFFFFF.
    Test 2 Word 7: scanned out 0x00000000 and scanned in 0xFFFFFFFF.
    The details of the first 8 errors have been provided.
    The utility will now report only the count of failed tests.
    Scan tests: 2, skipped: 0, failed: 1
    Do a test using 0xFE03E0E2.
    Scan tests: 3, skipped: 0, failed: 2
    Do a test using 0x01FC1F1D.
    Scan tests: 4, skipped: 0, failed: 3
    Do a test using 0x5533CCAA.
    Scan tests: 5, skipped: 0, failed: 4
    Do a test using 0xAACC3355.
    Scan tests: 6, skipped: 0, failed: 5
    Some of the values were corrupted - 83.3 percent.

    The JTAG DR Integrity scan-test has failed.

    [End: Texas Instruments XDS100v2 USB Debug Probe_0]

  • Additional information:

    I am using Windows 7 64-bit, Service Pack 1.

    I am using the

    -C2000 Resolver to Digital Conversion Kit

    with the

    -Piccolo TMS320F28035 Isolated controlCARD
  • Sorry for being out of loop due to weekend. Yes the resolver kit has a XDS100v2 as its on-board emulator. I hope you've taken care of all jumper settings?
  • James,

    I now have access to a computer with controlSUITE installed, and looking at the schematics for the TMDSRSLVR kit I can tell it is, in fact, a XDS100v1 (it uses a FT2232D device instead of the FT2232H of a XDS100v2). Thus the page description is wrong.

    James McCullagh said:
    -Piccolo TMS320F28035Isolated controlCARD

    That detail actually brought me a recollection of a similar issue I had a few months ago: some isolated controlCARDs do not have JTAG signals routed to the DIMM connector. Thus, looking at the F28035 isolated controlCARD schematics, you can tell this is the case for this board.

    In this case, you should connect the USB directly to the JTAG port of the controlCARD and power it through the 15V jack as well.

    From your description I wasn't sure you already tried that.

    Hope this helps,

    Rafael

  • Gautam, Rafael,

    Thanks for the responses.  I'm still seeing the same errors.

    To answer your questions....

    1. The documentation I have - TMDSRSLVR - Resolver EVM (R2.0) Kit - How to Run Guide - says only one thing about jumpers. It says

    "Make sure that the jumper J8 is not populated"

    There are no connections on or between the J8 jumper on my board.

    2. I have tried the "test connection" button with both XDS100v1 and XDS100v2. I get the same error with both options. I will use XDS100v1 from now on though.

    3.  When I test this, I've always connected to an outlet to power the 15V jack. With a multi-meter I have double checked that the 15V pin is at 15V....it is ~15.2V. There is a switch on the board that switches between the USB supply and 15V supply. I have tested this with the switch at both settings.

    To help I am attaching pictures of the board. Maybe you guys can see something I don't....

    Thanks,

    James

  • One more thing...sometimes when I try to build or rebuild a file, I get the following warning (not an error...just a warning)....

    "This project was created using a version of compiler that is not currently installed: 6.2.0 [C2000]. Another version of the compiler will be used during build: 6.4.6. Please go to CCS App Center to install the compiler of the required version, or migrate the project to one of the available compiler versions by adjusting project properties."

    I'm not sure how to resolve this, if it is important, or if it would be a reason for the "Test Connection" to fail.

    James
  • James,

    Thanks for sending the pictures. Perhaps I was not clear on my previous explanation, but can you disconnect the USB cable from the "USB1" connector on the base board and connect a USB cable to the USB-mini connector on the controlCARD itself? This is the mini USB connector at the left of your last picture, which should be marked as "J1" (at least according to the schematics I have here).

    The message you are seeing does not influence the ability to connect at all. It could potentially create different .out executables (given the differences in the compiler versions). If you are interested in installing the previous compiler release, please check sections 2.2 and 3 of the page below:

    processors.wiki.ti.com/.../Updating_CCSv6

    Hope this helps,
    Rafael
  • Rafael,

    Yes...that helped, and it definitely solves part of the problem. The mini-USB connector did not come with the kit. However, when I found and used a mini USB connector connected it to "J1", additional lights turned on and I am getting a different error when I push the "Test Connection" button. This new error is more specific, and it will hopefully be easier to debug. It is below....

    [Start: Texas Instruments XDS100v1 USB Debug Probe_0]

    Execute the command:

    %ccs_base%/common/uscif/dbgjtag -f %boarddatafile% -rv -o -F inform,logfile=yes -S pathlength -S integrity

    [Result]


    -----[Print the board config pathname(s)]------------------------------------

    C:\Users\jamesjmc\AppData\Local\TEXASI~1\
    CCS\ti\1\0\BrdDat\testBoard.dat

    -----[Print the reset-command software log-file]-----------------------------

    This utility has selected a 100- or 510-class product.
    This utility will load the adapter 'jioserdesusb.dll'.

    An error occurred while soft opening the controller.

    -----[An error has occurred and this utility has aborted]--------------------

    This error is generated by TI's USCIF driver or utilities.

    The value is '-151' (0xffffff69).
    The title is 'SC_ERR_FTDI_OPEN'.

    The explanation is:
    One of the FTDI driver functions used during
    the connect returned bad status or an error.
    The cause may be one or more of: invalid XDS100 serial number,
    blank XDS100 EEPROM, missing FTDI drivers, faulty USB cable.
    Use the xds100serial command-line utility in the 'common/uscif'
    folder to verify the XDS100 can be located.

    [End: Texas Instruments XDS100v1 USB Debug Probe_0]

    Any ideas on what may be the problem here?

    Thanks Again,
    James
  • James,

    Unfortunately no. The error you are getting now is related to the fact the PC can't recognize the JTAG debugger at all - before it was able to recognize it, but it was not able to talk to the device (which is consistent with the explanation I gave you on a past post).

    At this point, I can only ask you to double-check the Windows Control Panel and see if there is an instance of the XDS100 there - something shown in section 2.6 of the XDS100 wiki page.

    If that does not show up, double-check the USB cable you are using: either if it is broken, loose or is a charger-only cable (no data, only 5V power). I fell on the trap of using these charger-only cables several times already...

    Also, just to double check the connections, you should have something similar to what is shown on the screenshot below:

    Don't forget to put the switch SW1 to the ON position, so the processor and the resolver board are properly powered.

    Apart from that, I really don't know what else could be going wrong in this case.

    Hope this helps,

    Rafael

  • Rafael,

    OK, it may have been a loose cable. I wiggled it, and it showed up on the device manager. It was an older cable I found lying around in the lab. I ordered another.

    The setup now looks as follows. Before the light on the top left by the mini-USB was not on. Now it is. That seems like a step in the right direction.

    The good news (I think) is that I now get a new error when I push the debug button. I see the following:

    When I do "Test Connection" I get a similar readout. It is below:

    [Start: Texas Instruments XDS100v1 USB Debug Probe_0]

    Execute the command:

    %ccs_base%/common/uscif/dbgjtag -f %boarddatafile% -rv -o -F inform,logfile=yes -S pathlength -S integrity

    [Result]


    -----[Print the board config pathname(s)]------------------------------------

    C:\Users\jamesjmc\AppData\Local\TEXASI~1\
        CCS\ti\1\0\BrdDat\testBoard.dat

    -----[Print the reset-command software log-file]-----------------------------

    This utility has selected a 100- or 510-class product.
    This utility will load the adapter 'jioserdesusb.dll'.
    The library build date was 'Sep  4 2015'.
    The library build time was '21:59:23'.
    The library package version is '6.0.14.5'.
    The library component version is '35.35.0.0'.
    The controller does not use a programmable FPGA.
    The controller has a version number of '4' (0x00000004).
    The controller has an insertion length of '0' (0x00000000).
    This utility will attempt to reset the controller.
    This utility has successfully reset the controller.

    -----[Print the reset-command hardware log-file]-----------------------------

    The scan-path will be reset by toggling the JTAG TRST signal.
    The controller is the FTDI FT2232 with USB interface.
    The link from controller to target is direct (without cable).
    The software is configured for FTDI FT2232 features.
    The controller cannot monitor the value on the EMU[0] pin.
    The controller cannot monitor the value on the EMU[1] pin.
    The controller cannot control the timing on output pins.
    The controller cannot control the timing on input pins.
    The scan-path link-delay has been set to exactly '0' (0x0000).

    -----[The log-file for the JTAG TCLK output generated from the PLL]----------

    There is no hardware for programming the JTAG TCLK frequency.

    -----[Measure the source and frequency of the final JTAG TCLKR input]--------

    There is no hardware for measuring the JTAG TCLK frequency.

    -----[Perform the standard path-length test on the JTAG IR and DR]-----------

    This path-length test uses blocks of 64 32-bit words.

    The test for the JTAG IR instruction path-length failed.
    The JTAG IR instruction scan-path is stuck-at-zero.

    The test for the JTAG DR bypass path-length failed.
    The JTAG DR bypass scan-path is stuck-at-zero.

    -----[Perform the Integrity scan-test on the JTAG IR]------------------------

    This test will use blocks of 64 32-bit words.
    This test will be applied just once.

    Do a test using 0xFFFFFFFF.
    Test 1 Word 0: scanned out 0xFFFFFFFF and scanned in 0x00000000.
    Test 1 Word 1: scanned out 0xFFFFFFFF and scanned in 0x00000000.
    Test 1 Word 2: scanned out 0xFFFFFFFF and scanned in 0x00000000.
    Test 1 Word 3: scanned out 0xFFFFFFFF and scanned in 0x00000000.
    Test 1 Word 4: scanned out 0xFFFFFFFF and scanned in 0x00000000.
    Test 1 Word 5: scanned out 0xFFFFFFFF and scanned in 0x00000000.
    Test 1 Word 6: scanned out 0xFFFFFFFF and scanned in 0x00000000.
    Test 1 Word 7: scanned out 0xFFFFFFFF and scanned in 0x00000000.
    The details of the first 8 errors have been provided.
    The utility will now report only the count of failed tests.
    Scan tests: 1, skipped: 0, failed: 1
    Do a test using 0x00000000.
    Scan tests: 2, skipped: 0, failed: 1
    Do a test using 0xFE03E0E2.
    Scan tests: 3, skipped: 0, failed: 2
    Do a test using 0x01FC1F1D.
    Scan tests: 4, skipped: 0, failed: 3
    Do a test using 0x5533CCAA.
    Scan tests: 5, skipped: 0, failed: 4
    Do a test using 0xAACC3355.
    Scan tests: 6, skipped: 0, failed: 5
    Some of the values were corrupted - 83.3 percent.

    The JTAG IR Integrity scan-test has failed.

    -----[Perform the Integrity scan-test on the JTAG DR]------------------------

    This test will use blocks of 64 32-bit words.
    This test will be applied just once.

    Do a test using 0xFFFFFFFF.
    Test 1 Word 0: scanned out 0xFFFFFFFF and scanned in 0x00000000.
    Test 1 Word 1: scanned out 0xFFFFFFFF and scanned in 0x00000000.
    Test 1 Word 2: scanned out 0xFFFFFFFF and scanned in 0x00000000.
    Test 1 Word 3: scanned out 0xFFFFFFFF and scanned in 0x00000000.
    Test 1 Word 4: scanned out 0xFFFFFFFF and scanned in 0x00000000.
    Test 1 Word 5: scanned out 0xFFFFFFFF and scanned in 0x00000000.
    Test 1 Word 6: scanned out 0xFFFFFFFF and scanned in 0x00000000.
    Test 1 Word 7: scanned out 0xFFFFFFFF and scanned in 0x00000000.
    The details of the first 8 errors have been provided.
    The utility will now report only the count of failed tests.
    Scan tests: 1, skipped: 0, failed: 1
    Do a test using 0x00000000.
    Scan tests: 2, skipped: 0, failed: 1
    Do a test using 0xFE03E0E2.
    Scan tests: 3, skipped: 0, failed: 2
    Do a test using 0x01FC1F1D.
    Scan tests: 4, skipped: 0, failed: 3
    Do a test using 0x5533CCAA.
    Scan tests: 5, skipped: 0, failed: 4
    Do a test using 0xAACC3355.
    Scan tests: 6, skipped: 0, failed: 5
    Some of the values were corrupted - 83.3 percent.

    The JTAG DR Integrity scan-test has failed.

    [End: Texas Instruments XDS100v1 USB Debug Probe_0]

  • Hi,

    James McCullagh said:
    The good news (I think) is that I now get a new error when I push the debug button. I see the following:

    It is surely progress, given the PC is able to communicate with the XDS100 debugger.

    However, there is still a problem between the XDS100 and the device. Before trying to analyze the issue at a lower level, can you set SW2 on your controlCARD to different settings and see if you are able to connect to the device? This way you may prevent code that was previously loaded from running and therefore influencing the ability to connect to the JTAG.

    Also, can you double-check SW3 position? According to the controlCARD infosheet, it should be in the ON position for JTAG to communicate.

    If none of this works it may be a hardware problem. It seems that part of the circuit is somehow powered down, one of the ICs or Isolators is failing or a JTAG line is shorted to Vcc, as the Test connection utility reports that it sent all ones (0xFFFFFFFF) through the JTAG TDI pin but received all zeros (0x00000000) on the TDO pin as a response.

    That will require you to pull your DMM out and check voltages around the controlCARD, or ultimately repair/return it.

    Hope this helps,

    Rafael

  • Rafael,

    I turned all of the switches on, and I think this works. I have some questions just to verify and understand what is going on though. As soon as I understand a little better, I can verify that this question has been answered. The debug comes up an I see the following....is this what I am suppose to see? Does this mean I am successfully communicating?

    My other Questions:

    I have a SW2 and 2 switches in SW3. For the various settings I see the following behavior.

    SW2     SW3-1     SW3-2

    1            1               1           -> Can open debug, and lights are green

    1             0               1          -> Can open debug, but LD3 is on and red

    1             1                0         -> Can open debug, and lights are green

    1             0                0         -> Can open debug, but LD3 is on and red

    0             1                1         -> Cannot open debug with error 1135 described above, and lights are green

    0             0                1         -> Cannot open debug with error 1135 described above, and LD3 is on and red

    0             1                0         -> (The initial setting) Cannot open debug with error 1015 described above, and lights are green

    0              0               0         -> Cannot open debug with error 1135 described above, and LD3 is on and red

    1. I assume I use setting 111 or 110 above, but which one and why?

    2. What do the three switches do?

    3. Why does the LD3 light turn red when SW3 is off?

    4. I'm having trouble double checking functionality with a "Test Connection" once the Debug is working. Can I "Test connection" even if debug is working and communicating?

    Thanks Again,

    James

  • James,

    Your screenshot shows a successfully connected target, with code and symbols loaded, and the processor is halted at main(). 

    The details about the switches are shown in the board infosheet I have (supplied with controlSUITE and I send it attached below). It seems the switch designators are reversed in your board, but that shouldn't matter much.

    From there you can tell that SW3 (SW2 in your board) completely disables JTAG, therefore it explains the total inoperative status when this switch is OFF.

    Regarding SW2 (SW3 in your board), they define how the processor will boot when brought up from reset - if code is preloaded on the device, the status of the LEDs will be tied to what this code does. From your experiments you can tell the LED behavior is the same irrespective of SW3 (SW2 in your board).

    At last, once you have a proper debug session running, the "Test Connection" button ceases to work - basically the JTAG debugger is "locked" by the Debug Server system on CCS and no other process on your computer can access it.

    Hope this helps,

    Rafael

    F28035_ISOcontrolCAR-InfoSheet.pdf

  • Rafael,

    Great! Thanks for the help!

    Best,
    James