This thread has been locked.
If you have a related question, please click the "Ask a related question" button in the top right corner. The newly created question will be automatically linked to this question.
When using 6.45.1.29 SYS/BIOS programs for a Cortex-A15 compiled using the GNU v4.9.3 ARM compiler and CCS 6.2.0.00050 terminate either due to an error or calling BIOS_exit that the stack backtrace in the CCS debugger is incomplete, and doesn't show where in the application the error / exit occurred.
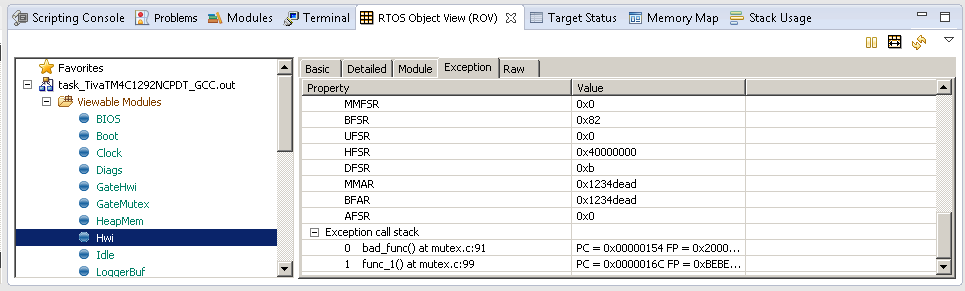
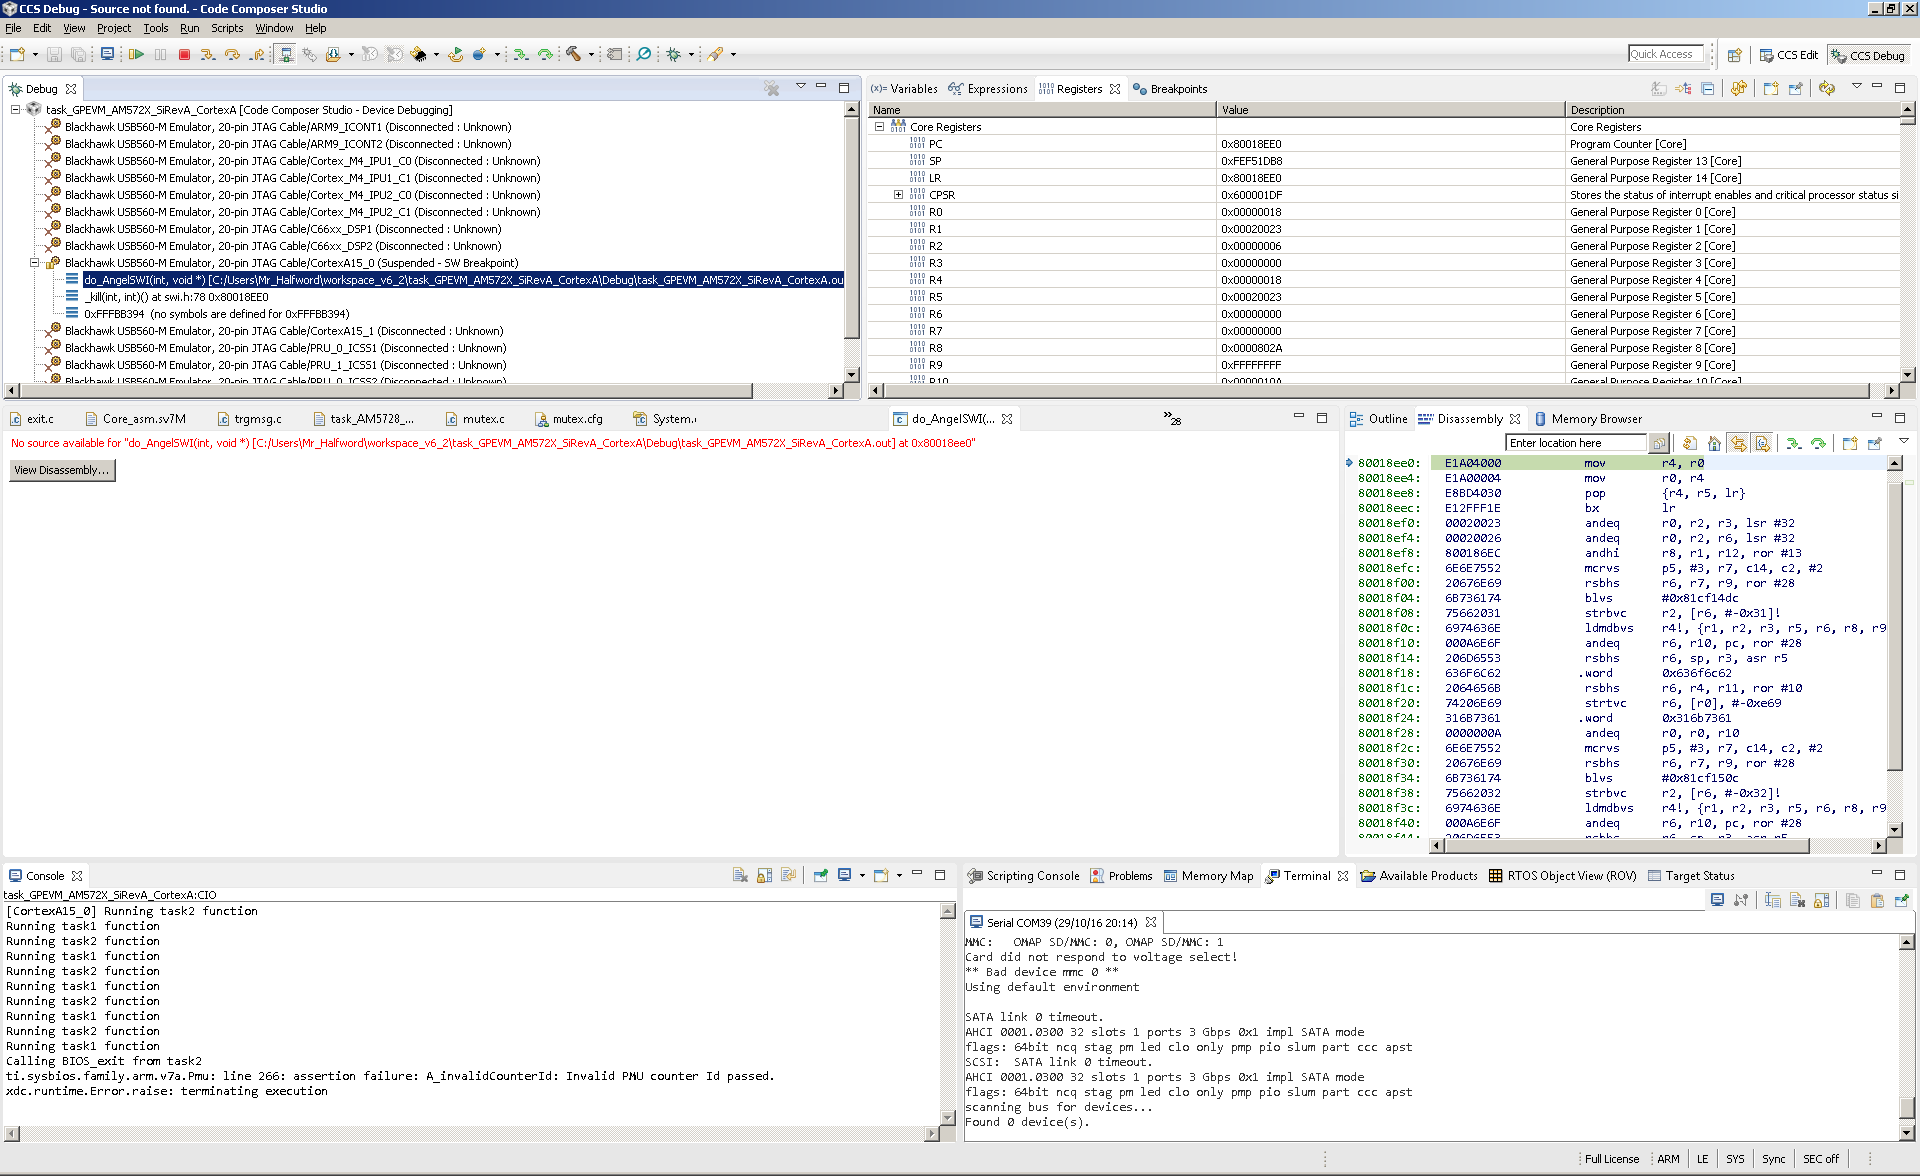
As an example after a test program causes an assertion failure the stack backtrace only contains the do_AngelSWI and _kill functions which are part of the GNU Newlib:
And after a call to BIOS_exit the backtrace ends at the xdc_runtime_System_processAtExit__E function, and doesn't show where in the application BIOS_exit was called from:
Not sure if the incomplete stack backtrace is a bug in CCS, or a limitation of the debug information in the SYS/BIOS and/or GCC Newlib libraries.
As a work-around found that setting a breakpoint on the following functions in a simple test program allowed the stack backtrace to report the function in the application which caused the error / exit:
- xdc_runtime_Error_raiseX__E is the case of a SYS/BIOS program being aborted due to an error
- xdc_runtime_System_exitStd__E in the case of BIOS_exit() being called
Attached is the test project used, which in the bad_func() function causes a SYS/BIOS error (but passing an invalid argument to the Pmu_getCount function) task_GPEVM_AM572X_SiRevA_CortexA.zip
The problem appears specific to use of the GNU ARM compiler.Chester Gillon said:When using 6.45.1.29 SYS/BIOS programs for a Cortex-A15 compiled using the GNU v4.9.3 ARM compiler and CCS 6.2.0.00050 terminate either due to an error or calling BIOS_exit that the stack backtrace in the CCS debugger is incomplete, and doesn't show where in the application the error / exit occurred.
If I repeat the test on a Cortex-A8 AM3352 target for which SYS/BIOS supports either the GNU or TI compiler:
1) When using the GNU compiler after a call to BIOS_exit() or after the program has been aborted with an error then the stack backtrace is incomplete, and doesn't show the application function which triggered the exit / error.
2) When using the TI compiler the stack backtrace is complete. Example for when the task2 function called BIOS_exit() :
Example for when the bad_func() function, called from task2, caused the program to be aborted due to a deliberate SYB/BIOS error:
The following attached example project for the Cortex-A8 in a AM335x built using GNU compiler v4.9.3 and SYS/BIOS 6.45.1.29 is a test of multiple level function calls task2 -> func3 -> func3 -> func3 -> func3 -> func3 -> func2 -> func1 -> bad_func where the leaf function bad_func causes a data abort. This allows a test of the stack backtrace decoding in the CCS 6.2.0.00050 debugger and the ROV Exception call stack view. func3 appears on the call stack 5 times as a test of recursion. task_GNU_BeagleBone_Black_CortexA.zipChester Gillon said:The problem appears specific to use of the GNU ARM compiler.
The project contains a modified version of the SYS/BIOS Exception_arm_gun.asm file to fix the problem in SYS/BIOS 6.45.01.29 ti.sysbios.family.arm.exc.Exception reports incorrect SP and LR values, leading to incorrect exception call stack
Found that changing the optimization level of the GCC ARM compiler can change if the correct stack backtrace is reported or not:
1) With the optimization level set to -O0 then the CCS debugger stack backtrace is correct up until the first instruction in bad_func():
However, after have step over the prologue in bad_func() the stack backtrace becomes incomplete, in that only the calling function is shown:
And once bad_func() has caused a Data Abort exception the ROV Exception Call stack shows the same incomplete backtrace as the CCS debugger did prior to the exception:
Note that the ROV Exception call stack shows the Frame Pointer (FP) as the invalid value 0xBEBE0000 for func_1() which is what I think causes the stack backtrace to be incomplete.
2) When the optimization level is changed to -O1 then the CCS debugger stack backtrace is complete once have stepped into bad_func(), shown just before the line which causes the Data Abort exception:
And once the Data Abort exception has occurred the ROV Exception call stack now also reports the complete stack backtrace which matches that in the CCS debugger prior to the exception:
Therefore, the problem appears to be that for some code generated by the GCC ARM compiler, the CCS debugger and ROV Exception call stack are unable to correctly determine the Frame Pointer, which leads to an incorrect stack backtrace.
I have tried the following, and the error of an incomplete CCS debugger stack backtrace persisted when targeting the Cortex-A15 in a 66AK2H14 running a SYS/BIOS program:desouza said:I will try to run this in CCSv7 and see if the error persists - I will also try with a different DWARF version (I think 4.9.3 defaults to DWARF4) and with a newer GCC compiler (I have 5.1.1 here). Perhaps these changes may bring some additional light to the problem.
1) Use CCS 7.0.0.00022, rather than CCS 6.2
2) In the Project Properties Build -> GNU Compiler -> Debugging:
- Change the DWARF version from 3 to 4
- Untick "Do not emit DWARF additions beyond selected version (-gstrict_dwarf)"
3) Change the GNU compiler v4.9.3 to v5.4.1
The GNU v5.4.1 (Linaro) compiler was downloaded from https://launchpad.net/gcc-arm-embedded/5.0/5-2016-q3-update/+download/gcc-arm-none-eabi-5_4-2016q3-20160926-win32.exe and installed in the ccsv7\tools\compiler\gcc-arm-none-eabi-5_4-2016q3 directory, which caused CCS 7 to detect the v5.4.1 compiler and allow it to be selected in the project properties for a SYS/BIOS project.
I wasn't able to check if the SYS/BIOS ROV Exception view also showed an incomplete stack backtrace, since Beta CCS 7.0.0.00017 or 7.0.0.00022 display a blank RTOS Object View (ROV)
Thanks for raising the bug. The bug text mentions the problem occurs with Cortex-A devices, which my above test cases used (with the Cortex-A devices running in ARM mode).desouza said:I filed the bug CCBT-2049
I have also found the same problem occurs with Cortex-M4 devices (running in THUMB mode) under CCS 7.0.0.00042. Attached are test cases which used a EK-TM4C129EXL
task_TivaTM4C1292NCPDT_GCC.zip task_TivaTM4C1294NCPDT_TI.zip
Used TI compiler v16.9.0.LTS and GCC compiler v4.9.3.
With the GCC compiler the stack bactrace in the debugger in the bad_func() about to generate an exception is incomplete :
And after the exception has occurred the ROV HWI exception view shows the same incomplete backtrace as the debugger did:
Whereas with the TI compiler the stack bactrace in the debugger in the bad_func() about to generate an exception is complete:
And after the exception has occurred the ROV HWI exception view shows the same complete backtrace as the debugger did:
Maybe CCBT-2049 should be updated to say the problem also occurs on Cortex-M as well as Cortex-A devices?
Using the Tiva example I confirm the problem has been fixed in CCS 7.4.0.00015.Ki-Soo Lee said:The fix for CCBT-2049 is implemented in CCSv7.4.0. I was wondering if can give it a try (if you have time) to validate the fix. For me, the issues in your screenshots for Tiva and AM3352 appear to be fixed (call stack appears as expected in CCSv7.4.0).
Will try the test cases for other targets when next get access to the hardware.
P.S. when I initially read the Release Notes for Code Composer Studio™ v7.4.0 failed to spot that CCBT-2049 has been implemented in CCSv7.4.0, since CCBT-2049 appears as part of the "Known Issues" table at the end, rather than in the "Bug Fixes" table in the "New in CCSv7.4.0" section.
Thanks Chester
Chester Gillon said:P.S. when I initially read the Release Notes for Code Composer Studio™ v7.4.0 failed to spot that CCBT-2049 has been implemented in CCSv7.4.0, since CCBT-2049 appears as part of the "Known Issues" table at the end, rather than in the "Bug Fixes" table in the "New in CCSv7.4.0" section.
Thanks for pointing this out. We reviewed the release notes and see that we have a few errors with the queries that generates the lists. We will be addressing this for future release. Sorry for the confusion.
My tests using CCS 7.4.0.00015 produced the same results in that:Ki-Soo Lee said:I was wondering if can give it a try (if you have time) to validate the fix. For me, the issues in your screenshots for Tiva and AM3352 appear to be fixed (call stack appears as expected in CCSv7.4.0). But I still have issue with your first test case on AM572x.
1) The Tiva and AM3352 test cases now produce the correct stack backtrace following the fix for CCBT-2049. In these test cases the program is terminated by an ARM exception, and the correct stack backtrace is now shown in the CCS debugger (prior to the exception) and in the ROV exception view (after the exception).
2) The AM572x test case still produces an incomplete stack backtrace following the fix for CCBT-2049. The AM572x test case causes SYS/BIOS to abort the program with an assertion failure, and therefore CCS 7.4.0.00015 still produces an incomplete stack backtrace in the event that a SYS/BIOS program complied with the GCC v4.9.3 ARM compiler terminates due to a SYS/BIOS error. Does this mean a new bug report should be raised for this test case?
For the AM572x test case under CCS 7.4.0.00015 if a breakpoint is set on xdc_runtime_Assert_raise__I the stack backtrace is correct at the point the breakpoint is hit, but once start stepping from that point the stack backtrace becomes incomplete.
From CCS/AM3357: Cannot see full callstack in many situations. another user appears to be seeing the same problem.
Tried compiling the test case using the GCC v6.3.1 ARM compiler, but the same incomplete stack backtrace was displayed.Chester Gillon said:he AM572x test case causes SYS/BIOS to abort the program with an assertion failure, and therefore CCS 7.4.0.00015 still produces an incomplete stack backtrace in the event that a SYS/BIOS program complied with the GCC v4.9.3 ARM compiler terminates due to a SYS/BIOS error.