This thread has been locked.

If you have a related question, please click the "Ask a related question" button in the top right corner. The newly created question will be automatically linked to this question.

CCS/66AK2H12: ARM seems to be working abnormally when trace is started for any core.

Part Number: 66AK2H12
Other Parts Discussed in Thread: SYSBIOS, , 66AK2H14, BEAGLEBOARD-X15, AM5728

Tool/software: Code Composer Studio

1. I'm using Blackhawk USB560v2 System Trace emulator.

When I start trace for any core (ARM or DSP), it seems that ARM does not work normally.

( I'm using TI-RTOS, SMP.in ARM)

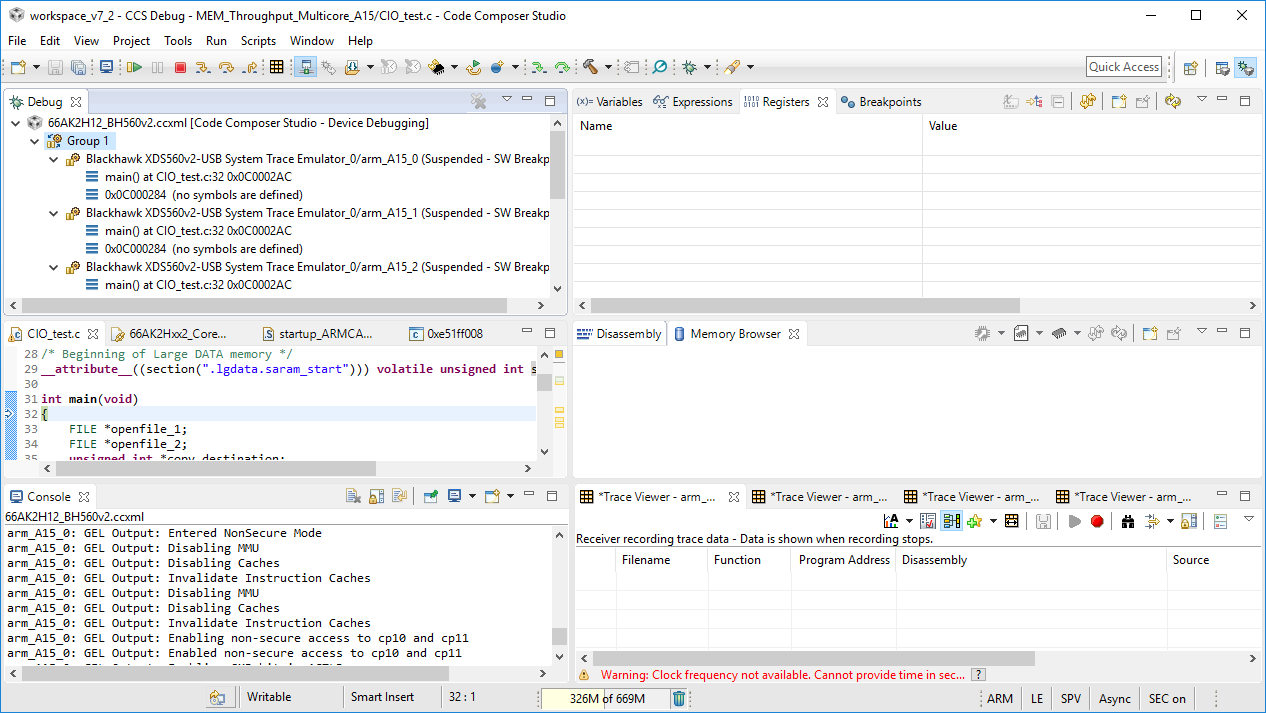
When I select Group of ARM cores in the Debug window and start trace (Tools->Hardware Trace Analyzer -> PC Trace) with transport type ETB,

CCS is terminated without any error or warning message.

And when I select a core (ex. A15_0 core or C66xx_0) and start trace with transport type ETB, all ARM cores are suspended as soon as I resume the ARM cores.

(at ti_sysbios_famiry_arm_a15_smp_Core_resetKeystone2__I().)

At this time, Trace viewer window does not display anything.

2. When I select ETB as transport type, It is available for both ARM and C66 cores?

  • Hi,

    I am trying to get a K2H board to test this scenario.

    In the meantime, I suspect you are running into an exhaustion of resources - if I recall correctly the ETB can only capture from a limited number of cores. However, CCS should never collapse.

    I will get back to you when I am able to test this.

    Regards,
    Rafael
  • Hi,

    Which version of CCS are you using? 

    I am able to properly set up an ETB Trace job for the four A15 cores simultaneously on my 66AK2H12 EVM board with a Blackhawk BH560v2 STM - no crashes.

    However, I am still trying to overcome some issues when running the code on all cores with ETB enabled. I will get back to this thread.

    The ETB on these devices are available for both ARM and C66x cores.  

    Regards,

    Rafael

  • Hi, Thank you for reply.

    I'm using various CCS version.

    6.2.0.00050,

    7.1.0.00014,

    7.1.0.00016,

    7.2.0.00013

    When I choose a sync group of ARM cores and start trace, CCSv 6.x are NOT terminated but CCSv 7.x are terminated.

    And in all CCS version, when I choose a core and start trace, ARM cores are suspended as soon as I resume them and trace viewer window shows nothing.

  • Hi,
    As I said in above comment, even in CCSv6.x, ARM core trace (using ETB) is not working. ARMs are suspended as soon as resuming them.
    Did you get the same result? If yes, do you have some solution to fix this?
  • Jiyoon Oh said:
    And in all CCS version, when I choose a core and start trace, ARM cores are suspended as soon as I resume them and trace viewer window shows nothing.

    I have previously reported Unable to collect PC Trace for ARM A15 core in 66AK2H14 using CCS 6.1.3 and XDS200 USB Onboard Debug Probe, and the problem was some missing entries in the device XML files. The referenced thread contains some work-arounds.

    I will try and repeat the crashes with CCS 7.

  • Thank you, Chester.
    But unfortunately, your solution is not working on my problem.

    desouza.
    Could you reproduce my problem? or could you resolve this problem?

    PC trace is no problem when I run ARM cores not grouped.

    But When I group the ARM cores and start PC trace, they are suspended as soon as they are started.

  • desouza said:
    I am able to properly set up an ETB Trace job for the four A15 cores simultaneously on my 66AK2H12 EVM board with a Blackhawk BH560v2 STM - no crashes.

    Rafael, your example program doesn't appear to be a SYS/BIOS SMP program. Whereas as Jiyoon is running a SYS/BIOS SMP program on the ARM cores.

    Attached is an example SYS/BIOS SMP program which runs on all four A15 cores of an EVMK2H and which shows problems in CCS 7.2 when attempting to start PC trace on all four A15 cores. 66AK2H14_SMP_dhrystone_CortexA15.zip

    [In the Target Configuration the device has been set to a TCI6638K2K rather than 66AK2H12 since the 66AK2H12 device file is missing some entries for trace - see https://e2e.ti.com/support/development_tools/code_composer_studio/f/81/t/511744]

    It is run on a EVMK2H with the boot mode set to "DSP no boot" and displays the results on the UART (Serial COM12 in the example below). Example of successful run when didn't attempt to start PC trace:

    The debug properties were set by:

    a) Deleting the .launches directory.

    b) Selecting Debug from the project properties and selecting a synchronous group:

    c) For each of the A15 cores in the Debug Project properties:

    - Unticking "Allow Software Breakpoints to be used" under Misc/Other Options. i.e. to use hardware breakpoints as recommended by SMP Debug

    - Unticking the option to run to main under Auto Run and Launch Options. If don't do that then got errors such as "Could not run analyzer on CortexA15_2. Cause: Cannot get control register value" when attempted to start PC trace on the group.

    With the above debug properties set when start the a debugging session a "Group 1 (Synchronous, Autoload)" is created, and all four A15 cores stop at the SYS/BIOS SMP entry point. At this point can select the group and start PC Trace on all four A15 cores:

    However, when attempt to Resume the group all four A15 cores change to (Running) for a few seconds but then return to (Suspended). None of the program counters on the A15 cores has advanced and the PC trace viewers are all empty. Multiple attempts to resume the group have failed with none of the program counters changing. The program is effectively stuck at the entry point.

  • Chester Gillon said:
    - Unticking the option to run to main under Auto Run and Launch Options. If don't do that then got errors such as "Could not run analyzer on CortexA15_2. Cause: Cannot get control register value" when attempted to start PC trace on the group.

    The following sequence describes how to get the errors about running the hardware analyser on the Cortex-A15 cores using the same example program as in the above post:

    a) Delete the .launches sub-directory.

    b) Start a debug session, and select a synchronous group for the Cortex-A15 cores:

    c) Core zero runs to main, and the other cores are suspended (in the SYS/BIOS SMP startup code waiting to be woken up by core zero):

    d) Attempt to start the PC Trace Hardware Analyser on the group of all Cortex-A15 cores, using the ETB transport:

    e) Get the following errors:

    And the Trace Viewer window only appears for the CortexA15_0 core.

    f) With the Group selected in the Debug window attempt to Resume execution. However, each time attempt to resume execution the Program Counter of the CortexA15_0 only advances by one instruction (which is shown in the Trace Viewer):

    g) Attempt to terminate the debug session. However, the debug session isn't terminated successfully leaving the following on display:

    At this point the Windows task manager shows that CCS has two threads taking continuous CPU. In this state CCS is unable to start another debug session so have to exit and then restart CCS.

    The failure in this and the previous post were initially found using CCS 7.2.0.00013 and TI Emulators 7.0.48.0 running under Windows 10.

    Running CCS 7.2.0.00013 and TI Emulators 7.0.48.0 under Ubuntu 16.04 shows the same failures as under Windows 10.

    Attempting to test using CCS 6.2.0.00050 and TI Emulators 6.0.628.1 under Windows 10, and CCS 6.2 crashes when attempt to start the PC Trace Hardware Analyzer on a group of four CortexA15 cores.

  • Chester Gillon said:
    However, when attempt to Resume the group all four A15 cores change to (Running) for a few seconds but then return to (Suspended). None of the program counters on the A15 cores has advanced and the PC trace viewers are all empty. Multiple attempts to resume the group have failed with none of the program counters changing. The program is effectively stuck at the entry point.

    That problem used:

    - CCS 7.2.0.00013 with TI Emulators 7.0.48.0 under Windows 10.

    - A SYS/BIOS SMP program running on four Cortex-A15 cores of a 66AK2H14.

    - A EVMK2H with an XDS200 on-board debug probe.

    The SYS/BIOS SMP program was ported to run on two Cortex-A15 cores of a AM5728, in a BeagleBoard-X15 connected with a Blackhawk USB560-M 20-pin JTAG cable debug probe. The AM5728 project is attached. AM5728_SMP_dhrystone_CortexA15.zip

    Attempting to use the PC Trace Hardware Analyser on a group of the two Cortex-A15 cores of the AM5728 also suffers the problem of the program being stuck at the entry point. A synchronous group was created for the two Cortex-A15 cores, software breakpoints disabled and disabled running to main.

    When start a debug session the cores at halted at the ti_sysbios_family_arm_a15_smp_Core_resetOMAP5xxx__I entrypoint. Started the PC Trace Hardware Analyser on the group, with no errors reported. However, when attempt to Resume the group both Cortex-A15 cores change to (Running) for a few seconds but then return to (Suspended). None of the program counters on the A15 cores has advanced and the PC trace viewers are all empty. Multiple attempts to resume the group have failed with none of the program counters changing. The program is effectively stuck at the entry point. When attempting to run an "Trouble preparing for synchronous execution: Channels required for sync run or halt are not available" error can be reported for one or both Cortex-A15 cores:

    Therefore, the problem with trying to start the PC Trace Hardware Analyser on a group of Cortex-A15 cores has been seen on two different devices and two different debug probes.

  • Is there anyone who help me to solve ARM PC trace issue?
  • Hi everyone,

    Please apologize for the delay; it took me some time to borrow again another 66AK2H EVM board to test all this.

    I was able to reproduce this issue and unfortunately at this point I don't have a workaround for the problem of simultaneous PC Trace sessions via ETB. However, I am using CCSv7.3.0 and could not reproduce the collapse at the end of the debug session as reported by Chester.

    I filed the bug number CCBT-2155 to address this.

    I apologize for the inconvenience,
    Rafael
  • Hi everyone,

    I want to mention this bug was fixed in the upcoming release of the TI Emulators component (release 7.0.89.0) to be released soon. The operation is successful as shown in the video below.

    Please apologize for the trouble,

    Rafael