Because of the holidays, TI E2E™ design support forum responses will be delayed from Dec. 25 through Jan. 2. Thank you for your patience.

This thread has been locked.

If you have a related question, please click the "Ask a related question" button in the top right corner. The newly created question will be automatically linked to this question.

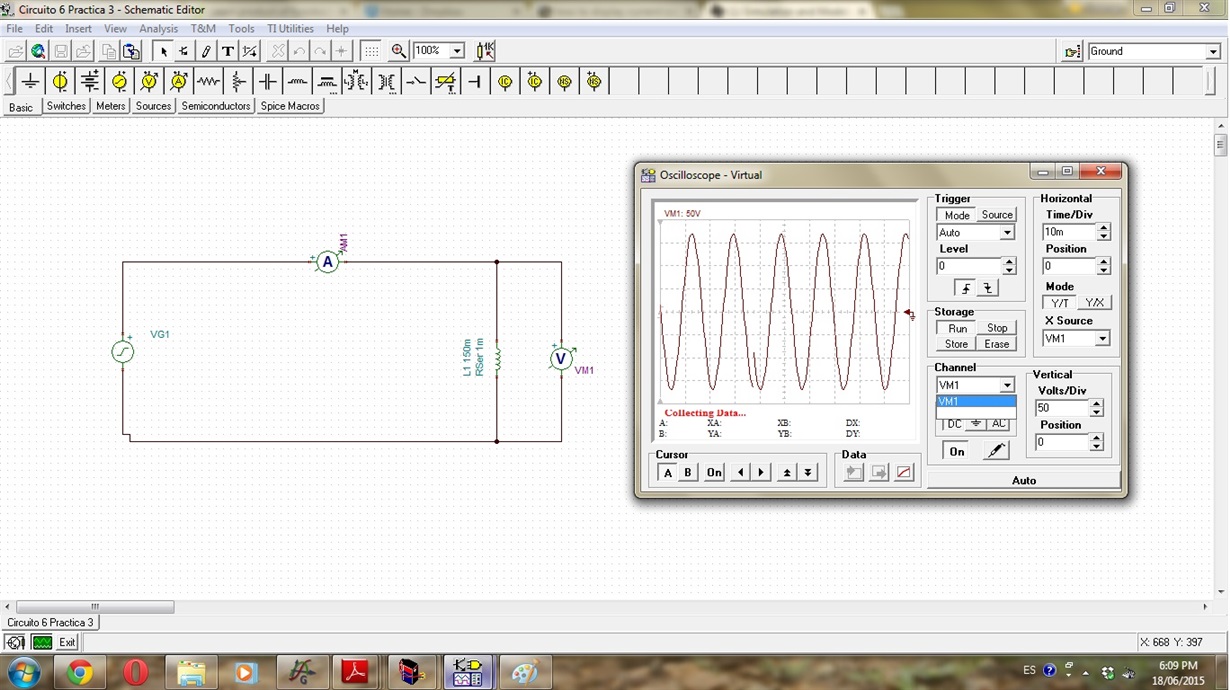
Is it possible to display a current waveform as well as voltage waveform using the virtual Oscilloscope from TINA?

  Hello!

I have been asked by my lab professor to display the voltage as well as the current waveforms of the following series RL circuit. I have managed to display the voltage waveform on the virtual oscilloscope, thanks to the advice of a member of the TI Community on the forum,  but how can I display the current waveform as well as the voltage? As can be seen, there is an ammeter and a voltmeter connected to the circuit. I suspect the vertical axis of the graph would have to be changed in order to depict the current.


  • Hi Richard,


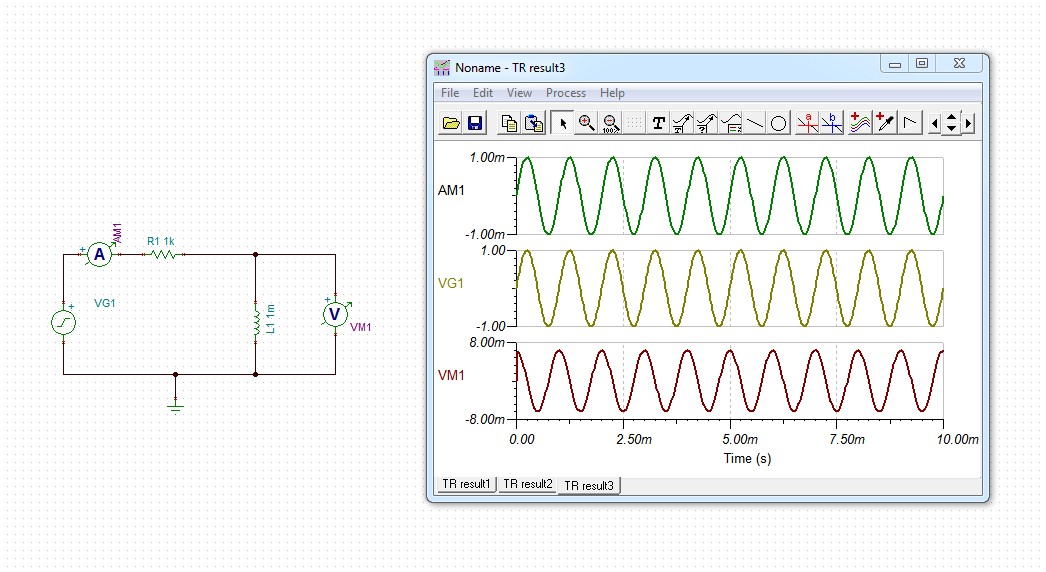
            Is it a requirement for you to use the scope? You can view the voltage and current in the diagram window under the Tools menu. Just run the sim and you should see the voltage and current see picture below

    I also noticed that you don't have a resistor in series with your inductor, are you using the amp meter resistance as R in the RL circuit?

    Regards,

    Marcos

  • HI Marcos

     Thanks for the info. I opened the diagram window under Tools and it remained blank...How can I cause the waveforms to appear? And where do I hit to run the simulation? I haven't found a RUN button as yet...

    Also when I connect a 1K resistor in series with the ammeter it reduces the voltage and current readings on the multimeter..

  • Hi Richard,

            I'm assuming you are trying to perform a transient simulation on your circuit, if that is the case, click on the analysis tab (see picture)

    and navigate to Transient. The following transient simulation setup window will popup:

    Select your transient options and press ok. Once the simulation is finished, the diagram window will show the graphs depicting the voltage/current vs time of the selected test points.

    The cutoff frequency for this filter is directly proportional to the value of the series resistance. It is ok to see some drop depending on the input frequency and the resistance value.

    Let me know if this helps,

    Marcos