This thread has been locked.

If you have a related question, please click the "Ask a related question" button in the top right corner. The newly created question will be automatically linked to this question.

Effect of Pattern With and Exposure Time on the SNR


Good day gentlmen,


We have performed many tests in order to characterize your spectrophotometer in terms of SNR, and decided to evaluate the Noise Free Counts formula in order to compare our current Golden sample with your new sopectrometer.

The formula is reported below:


Where:

Ref-i=Intensity of the reference spectra at wavelength-i

Dark-i=IUntensity of Dark spectra at wavelength-i

I =standard deviation of signal dynamic (( Ref-i ) – ( Dark-i ) )


The design of the experiment is based on the following rationales:

  1. The spectra wavelength range equal to the max available with DLP instrument;

  2. The number of points equal to 128;

  3. The pattern width equal to 10nm;

  4. The average equal to 1 in order to reduce the total spectra acquisition time;

  5. Pattern type Hadamard in order to maximize SNR.

  6. Exposure time is the variable parameter use in order to increase the SNR: starting from 0.635ms to 15.24ms.

Our results driven to the following observations: :


  1. Increasing the exposure time: there is  a significant improvement moving from 0.635ms to 1.270ms ( about X2 factor ) while increasing again the exposure time there is a clear saturation effect that fix the NFC about 1500 counts with a time of 5.080ms. Moving to 15.24ms NFC decrease up to 1200 counts.

  2. Increasing the wavelength step from about 6nm up to 8nm, keeping constant all others parameter with the exposure time 15.24ms there is a reduction of the NFC to about 1150 counts.


Considering that our golden sample provides in the same wavelength range an average NFC about 6200 counts ( keeping the average equal to 1! ), we are wondering how we can work in order to reach a NFC value close to our current one.

Your comments about our test results on the dependence of exposure time vs SNR in case of Hadamard pattern will be appreciated. Honestly we expected a better improvement increasing the exposure time.

We are wondering also if you performed a similar evaluation of SNR and if you have data to share.


  • Hi Alberto,

    It looks like the format for the formula that you posted does not show up correctly in the forum thread. Can you please resend the formula in a different format - maybe attach it as an image/screenshot?

    Thanks,
    Dylan

  • Hallo Dylan,

    thanks for your feedback.

    I recognize that the formula was gone when I push the POST button.

    Now I inserted as an external file, I suppose it will work.

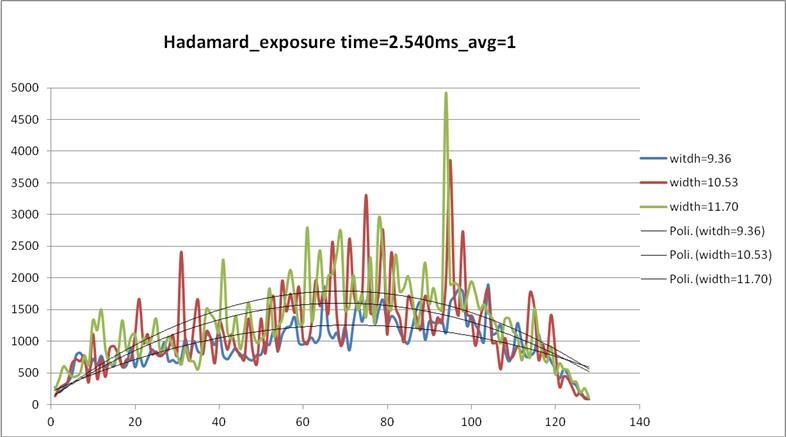
    By the way, Looking at the results we obtained so far in terms of NFC trend vs "pattern with" we have noticed that there is no a clear trend looking in detail at datapoint level, even if there is a trend line in Agreement with our expectation. Below, I report a graph obtained with our device, an externakl light source Always ON, Average = 1, Banwith 900-1700 and 128 data points: 

    I am wondering if you can give me a proper reading key of this data, at this point I am wondering if there is a repeatibility issue in this experiment.

    I really look forward for your

  • Hi Alberto,

    It looks as if this NFC count computation uses the standard deviation of all the measurements instead of the standard deviation of the difference between successive scans. This causes the measured noise to include the drift of the optical signal at the input slit. If the signal at the slit has long-term drift, then at long integration times the NFC count computation will be dwarfed by this long-term drift rather than short-term noise in the system. This could cause the observed data which shows that for increased integration times, the NFC count improves up to a point, and then starts getting worse.

    Do you have data showing that the light source being used is stable to better than 0.01% brightness variation over the test period? By your definition of the NFC count noise, a 0.01% variation in lamp intensity could limit the NFC count SNR to 10,000:1 even if the SNR of the optical engine and detector were infinite.

    How many scans are you taking for the computation? For instance, we typically use 100 to 500 scans to get a stable measurement of SNR. If you measured the SNR by NFC count method with only a few scans, I would expect the computed NFC count SNR to vary widely if you repeat the same procedure multiple times. Be aware that if the light into the slit is unstable, then increasing the number of scans may actually decrease the reported NFC value since the standard deviation is considering the long term illumination drift in addition to instrument noise after the slit.

    Regards,
    Dylan