This thread has been locked.

If you have a related question, please click the "Ask a related question" button in the top right corner. The newly created question will be automatically linked to this question.

DS90UB954-Q1: Margin Analysis Result

Part Number: DS90UB954-Q1

Hi TI support team

Some question about the DS90UB954 MAP margin analysis result, you can find the drawing in below. 

Please give your comments. 

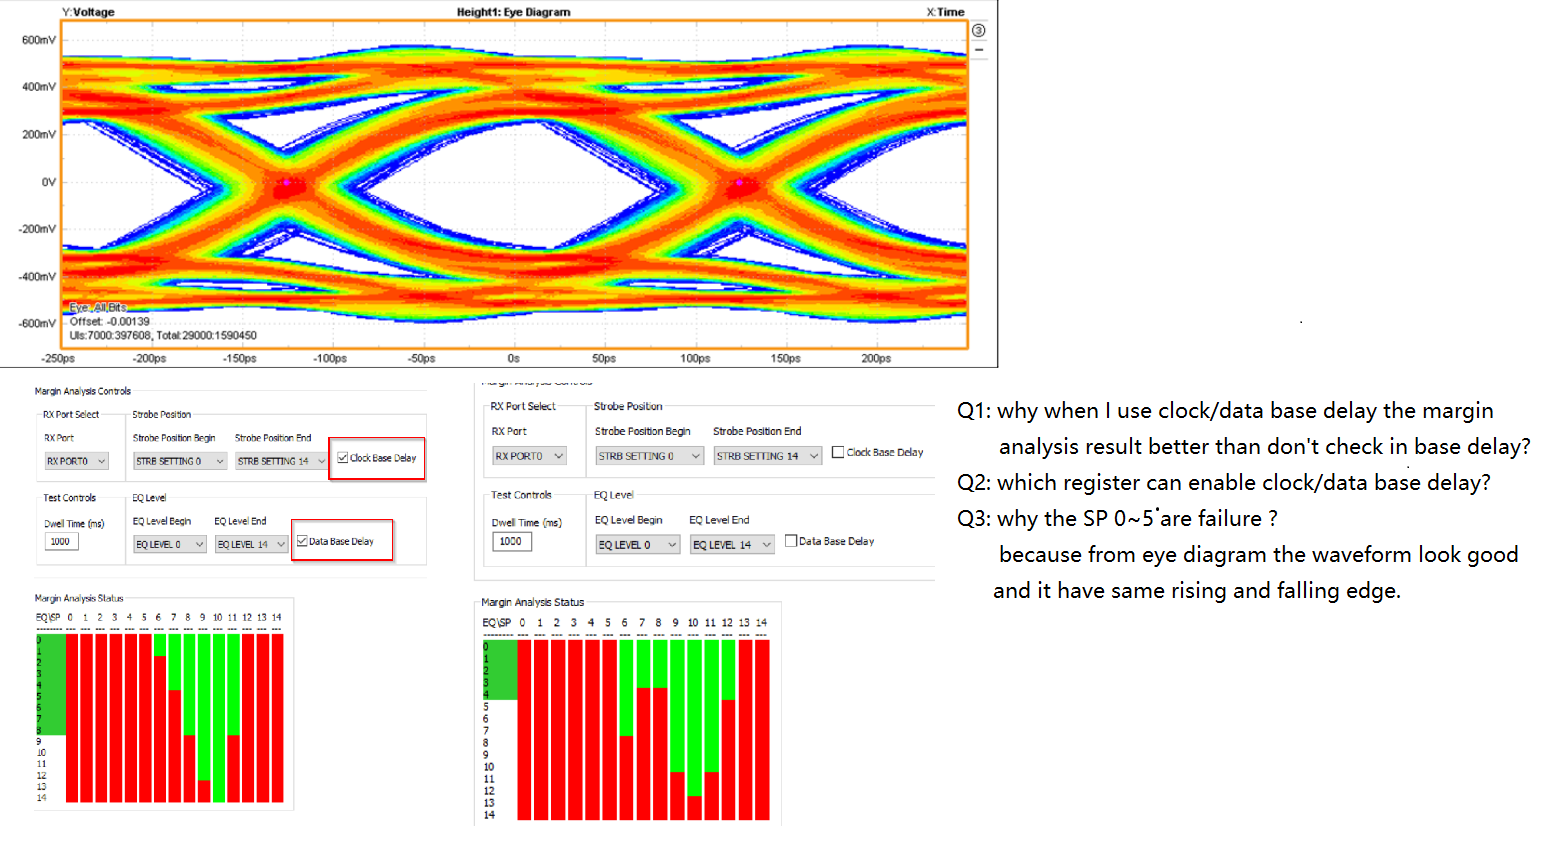
Q1: why when I use clock/data base delay the margin analysis result better than don't check in base delay?
Q2: which register can enable clock/data base delay?
Q3: why the SP 0~5 are failure ?  because I have test the CMLOUT eye diagram the waveform look good and it have same rising and falling edge. but I have confuse about your margin analysis result. 

Thanks

Yutai

  • Hi Yutai, 

    The clock and base delay determines the strobe position, so when you check both boxes this better sampling position for your signal. You can control the delay in register 0xb0 = 0x04, 0xb1 = 0x08, 0xb2 = 0x?? (see page21-22 of app note linked below for details on the value). SP0-5 may be sampling the signal at the edge of the eye which is why there are red. CMLOUT is better suited to monitor the link for gross signal errors which is why we always recommend using MAP to diagnose the link integrity. T

    I am linking this app note because I think it will help provide some more info that you can read. 

    www.ti.com/.../snla301.pdf

  • Hi Sally

    The SP0~5 sampling the late (clock delay) case and SP14~9 sampling the early (data delay) case. 

    But from the test eye diagram result, I don't find any different for rising edge and falling edge. 

    Why the SP0~5 are red in MAP tool. 

    Another query:

    The strobe positions check from register 0XD6 (clock delay); 0XD7(data delay) and 0X41 (S-Fliter_max~min), Is it correct ?

    The EQ value check from register 0XD5 (AEQ max~min) and 0XD4 (EQ 2 stage value and EQ1 stage value) , Is it correct ?

    Thanks

    Yutai

  • Hi Yutai, 

    I mentioned before that the CMLOUT eye diagram helps with diagnosing gross error margins, so this may not have a 1:1 correlation with the sample position. 

    I'm sorry, I don't understand the questions. What do you mean? Do you mean how to monitor or how to set limits?

    Thanks

    Sally

  • Hi Sally

    I have confuse about the strobe positions 7 and 8 are red after EQ level 4. 

    From TI application notes the SP7 is middle for sampling, normally the middle positions is best for sampling. 

    Please let me know the reason the SP10 is the best positions. 

    Thanks

    Yutai

  • Hi Yutai, 

    if you refer back tothe appnote figures, you will see that SP value 7/8 are not always necessarily the best values for the system. The optimal SP value varies across different system parameters. If you refer to figure 6 in the app note, you will see that the minimum criteria for setting the AEQ bounds is a minimum of 4 continuous green SP, so I would set your bounds for 6 - 12 or even 7-11 for the SP level. 


    THanks

    Sally 

  • Hi Sally

    From DS90UB954 datasheet , support the SSC (Spread Spectrum Clocking ) +/- 0.5% OSC 

    Does the different SSC clock will impact the MAP result ? 

    Thanks

    Yutai

  • Hi Yutai, 

    SSC is implemented to help with emissions testing. SSC can help with emissions because it helps spread the energy around a central frequency rather than all the energy sitting in one exact frequency. I don't believe this will impact MAP. 

    Thanks

    Sally