This thread has been locked.

If you have a related question, please click the "Ask a related question" button in the top right corner. The newly created question will be automatically linked to this question.

TM4C123GH6PGE: Hard Fault Debugging

Part Number: TM4C123GH6PGE

Hi all,

This is a shot in the dark because I am stumped debugging a random hard fault that is happening in my code.

This fault occurs seemingly randomly, sometimes days in between or sometimes even months. I have tried catching the fault while in a debug session with a JTAG attached but have had no luck for months. So I don't have to sit next to the micro with a debug session going and a JTAG attached, I have added some register information that I save to flash in my fault handler. Not the most sophisticated way to do it, but I was hoping I could reverse engineer the problem once I could observe the register stack.

I have gotten a few crash dumps and have started picking apart the register meanings, but I am thoroughly confused by what I see. I wont list everything here, but the important registers I see are as follows:

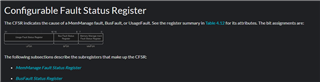
The CFSR register has a value of 1. This tells me that an access violation has occurred (IACCVIOL). When I first started doing these crash dumps, the registers were telling me that it was an "imprecise fault" which means a lot of the information in the registers is useless. After googling, people suggested to turn write buffering off to turn imprecise faults into precise faults. I did this and that is how I found that it was an access error.

At this point I was excited because the documentation for IACCVIOL states "When this bit is 1, the PC value stacked for the exception return points to the faulting instruction. The processor has not written a fault address to the MMAR." Great, I can look at the PC value, which I also wrote to flash, and can narrow down what instruction is causing the problem.

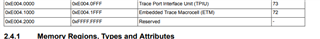
The problem is, the PC value that is in the register stack in the fault handler is the value "0xFFFFFFEC". This value has consistently been in the PC register for multiple crash dumps. I am at a loss because this address is 19 bytes away from the end of the TM4C123 chip memory itself. It is also firmly in a "reserved" area of memory.

From datasheet:

While I agree that trying to access this memory should generate a fault, as it is reserved. Am I wrong in interpreting the documentation as saying the instruction that caused the fault is at the PC value. What program instruction could possibly be at 0xFFFFFFEC? I am open to the possibility that maybe the value in the PC is garbage, but from reading the ARM register documentation, it seems like it specifically calls out "When this bit is 1, the PC value stacked for the exception return points to the faulting instruction"

Any advice, ideas, or thought is much appreciated. The address being in a chunk of reserved memory almost at the end of the chip is really throwing me for a loop:)

Thanks!

  • Hello Mike,

    That's really puzzling for certain because there are no instructions in that region. It makes me wonder if somehow the stack got corrupted. Have you verified there are no stack overflows occurring or possibly memory leaks (overfilled buffer, malloc issues, etc.)

    It looks like you are working from Arm MCU manual with the IACCVIOL bit and such? It's not one I recognize from TM4C datasheet.

    Have you tried doing the same with the dedicated TM4C register? Register 76: Configurable Fault Status (FAULTSTAT), offset 0xD28?

    I've never debugged a fault for this device with the Arm manual guidance, only ever using things like FAULTSTAT. So maybe there is something the Arm default error handling isn't telling you that the FAULTSTAT register would.

    Best Regards,

    Ralph Jacobi

  • Hi Ralph,

    I appreciate the response! Yes the IACCVIOL bit is from the Configurable Fault Status register from the Arm MCU manual. It is the equivalent of the IERR bit that is in the Configurable Fault Status in the chip's datasheet. I don't know why they change the bit name :)

    The description of the IERR bit is the same as IACCVIOL with an added sentence of "This fault occurs on any access to an XN region, even when the MPU is disabled or not present." So I would assume if 0xFFFFFFEC is really in the program counter, then it makes sense why there would be an access to an execute never region.

    At this point I can believe that maybe 0XFFFFFFEC is somehow getting into the PC value. Then when it jumps there, the fault happens. Like you pointed out, now it is a question of how did that value get there.

    There are no mallocs or callocs in the code thankfully. So that would eliminate any faulty dynamic memory allocation stuff.  I think I will focus on the overflowing buffers item you mentioned. We do a lot of constant I2C reads and I am not 100% sure how we are storing/processing that data. Perhaps we are overflowing an array or using incorrect data types for what we are reading.

    Thank you for the suggestion!

  • Hello Mike,

    Another reason could be something overran a count or a negative result occurred from a calculation that shouldn't be negative. In signed numbers that is a negative number not far from 0x0000.

    I checked with my colleague and he strongly suspects as corrupted stack is the reason as well.

    Here is a means to check for stack overflow: https://e2e.ti.com/support/microcontrollers/arm-based-microcontrollers-group/arm-based-microcontrollers/f/arm-based-microcontrollers-forum/1164811/tm4c1230e6pm-reset-of-micro/4386491#4386491

    I am not sure how well that will work for your system though given the challenge you have with debugging it, but if you can connect to the device after a fault, the memory locations should be retrievable still to see if the stack may have overflowed.

    Best Regards,

    Ralph Jacobi