This thread has been locked.

If you have a related question, please click the "Ask a related question" button in the top right corner. The newly created question will be automatically linked to this question.

[FAQ] MCU-PLUS-SDK-AM263X: How to perform Real time debug using Memory Browser Window

Part Number: MCU-PLUS-SDK-AM263X

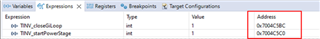
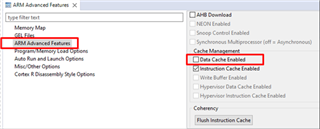
How to view the variables/ registers in real time without pausing R5 core in CCS?

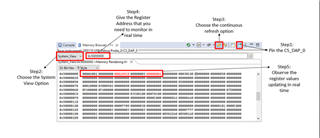
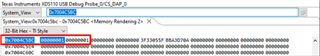
How to debug using Memory Browser Window in CCS?

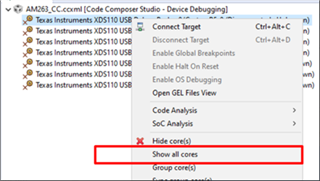
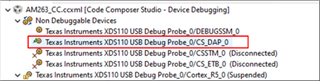
How to use DAP to connect to Memory Browser in CCS for AM263x

  • For monitoring of memory regions in run-time without pausing the code, Memory Browser can be used with fast refresh rate. This method is achieved through the Debug Access Port connected through JTAG.

    For more information regarding the DAP support in Arm R5, refer to https://developer.arm.com/documentation/102585/0000/what-is-a-debug-access-port

    In AM263x TRM → refer to section 14.1.3.3.1 DAP in Chapter 14 On-Chip Debug

    Follow the below steps for continuous monitoring:

    • Go to View and open Memory Browser window. Choose the DAP and pin it to the Memory Browser window. Click on the System view and choose Continuous Refresh Option for continuous monitoring.
    • Now run your code. This will allow you to debug Memory regions in run-time without the need to pause R5 core.

    • The below picture shows on how to pin the CS_DAP in memory browser.

    • Now, you can view the values of registers refreshing in real-time, without pausing the R5 core.

    How to view the global variables in real-time:

    • If your global variable is present in RAM, then you can directly search for the address in Memory Browser.
    • If your variable is present in TCM, then use attribute keyword to place it in OCRAM for it to be visible in the Memory Browser.
    • For example to view any global variable in memory browser define the variable as below, here the variable: TINV_startPowerStage is taken as example.
    • In the Application source file: volatile int32_t TINV_startPowerStage __attribute__((__section__(".DebugData")));
    • In the linker.cmd file:     .DebugData   : {} palign(8)            > OCRAM 

      These variables can be monitored and modified in the memory browser as shown in the below picture.

    • Now, you can view the values of global variables updating in real-time, without the need to pause the R5 core.
    • If the values are not being refreshed in real-time, pause the core and try disabling the data cache. To do this, go to Tools →  open ARM Advanced features and → uncheck the Data Cache Enabled option.

    • Now resume the core execution and you should see the real time memory update.

    Regards

    Sri Vidya