This thread has been locked.

If you have a related question, please click the "Ask a related question" button in the top right corner. The newly created question will be automatically linked to this question.

TMS320F28069M: Sampling Sine wave using ADC.

Part Number: TMS320F28069M

Sir/Madam,

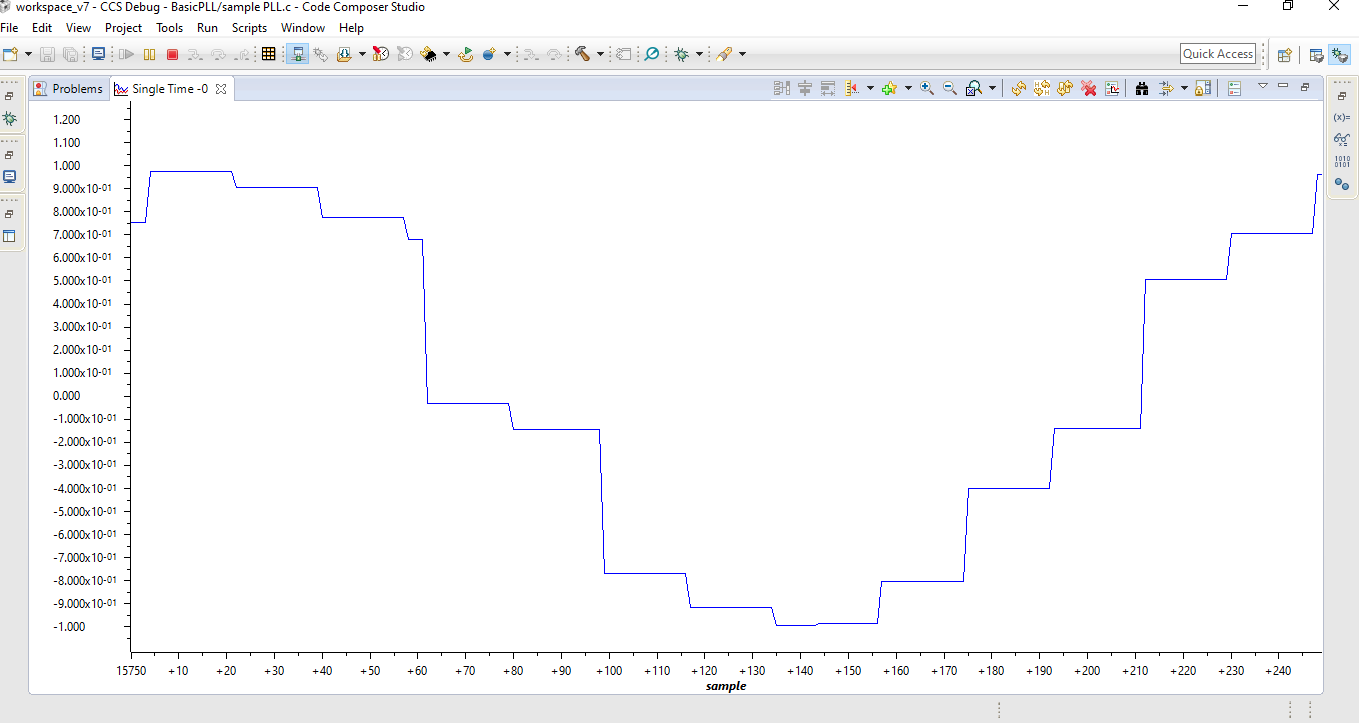
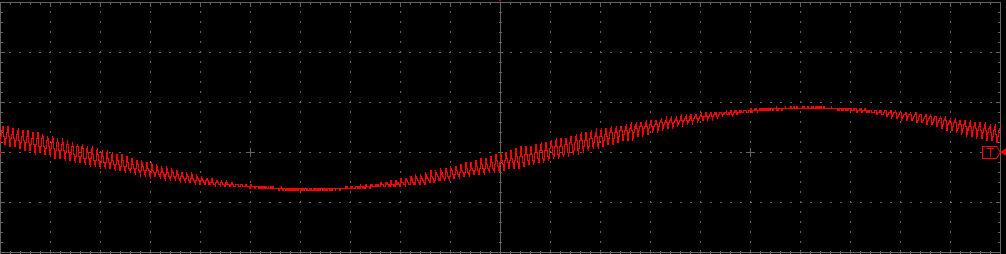
I am generating a sine wave at the DAC1 pin and connecting it to ADCIN_A6. The output of ADC is stored in an array (the array size is 500 elements) and the result is observed using the CCS graph tool. I am using CPU Timers for creating an interrupt periodically every 40 microseconds. The expected wave is a sine wave but the output that I am observing with the help of the CCS graph tool is not a sine wave. The waveform obtained in the CCS graph tool is shown below.

Please help me.

  • ADDAGUDURU SURYA KIRAN,

    Can you clarify how this is different from your expectations?  Does the amplitude match?  How many samples per cycle do you expect?  Does the signal on the A6 pin look correct on a scope?

    -Tommy

  • Sir,

    Thanks for your reply. 

    1. Can you clarify how this is different from your expectations?

    Ans: I am expecting a pure sine wave but it was not a pure sine wave.

    2.  Does the amplitude match?

    Ans. Yes

    3.  How many samples per cycle do you expect?

    Ans. Everything is meeting my expectations. But the waveform is not purely sinusoidal.

    4. Does the signal on the A6 pin look correct on a scope?

    Ans. Yes


  • ADDAGUDURU SURYA KIRAN,

    From what you are saying, the sampling rate, measured frequency, and measured amplitude are all correct.  In this case, it might be a problem with the CCS graph.  Can you save off 200 continuous samples into an array and view the results with an offline graphing tool like Excel?

    -Tommy

  • Sir,

    Thanks for the reply. 

    Q) From what you are saying, the sampling rate, measured frequency, and measured amplitude are all correct?

    Ans) I calculated it and then I fixed my ISR frequency. 

    I tried to plot it in excel, I am getting the same waveform as in the CCS Graph. 

    If the waveform shown below is given as input to the ADC. Does it affect the output?


  • ADDAGUDURU SURYA KIRAN,

    There is insufficient information to form any thoughts.

    Can you describe the frequency and amplitude of the fundamental input signal and the ADC sampling rate that you have configured?

    Also, please describe any signal conditioning on the ADC input.

    -Tommy

  • ADDAGUDURU SURYA KIRAN,

    It has been a while since your last update.  I assume that you were able to resolve your issue.

    If not, please reply to this thread.  If the thread has locked due to timeout, please create a new thread describing the current status of your issue.

    -Tommy