This thread has been locked.

If you have a related question, please click the "Ask a related question" button in the top right corner. The newly created question will be automatically linked to this question.

Changing Vcore setting from 0->1->2 leads to undefined state when JTAG is connected

Other Parts Discussed in Thread: CC430F5147, CC430F6147, CC430F5137, CC430F6137, CCSTUDIO, MSP430WARE

I'm experiencing some problems in my project based on a CC430F6147 & CC430F5147 microcontroller.
The microcontroller's digital voltage (DVcc) runs on 3V, and the VCore is being set from value 0 to value 2 (stepwise via the SetVCore hal_pmm library function) to be able to have proper RF transmission.

In the final product, the DVcc needs to run at 2.5V, and there the problem arises:
When no JTAG is connected, everything works as expected, but when the JTAG connection is used, the SW does get in an undefined state right after setting the VCore to value 2 (1.8V):

unsigned int SetVCoreUp (unsigned char level)
{
...
PMMCTL0_L = PMMCOREV0 * level;
// Wait until new level reached
if (PMMIFG & SVMLIFG)
while ((PMMIFG & SVMLVLRIFG) == 0);
...

--> I'm still breaking on the "if" statement when stepping through the code, but a step to the next line gets me timeout of the jtag connection (I can still see activity on the JTAG lines, and no reset of the device).

Another effect I can see, is that when starting a debug session, it sometimes can not erase the flash, although I can see a lot of traffic on the TDI & TDO pins:
>MSP430: Trouble Writing Memory Block at 0x8000 on Page 0 of Length 0x4986: Could not erase device memory
A second attempt is always successfull to download & start the application. (I tend to believe that i always see this behaviour when the device has been powered off first)

I'm using an MSP-FET430UIF usb debugger interface and the JTAG debugger is not powering the board.
The DVCC is connected through pin 2 back to the debugger for voltage reference. In CSS, i've changed the output voltage from 3 to 2.5V.

Additionally I've tried following things with no luck:
- first run the code on 3V, then lower in the middle of the execution the voltage to 2.5V. I see that debugging is not working anymore (break instruction doesn't break: >MSP430: Trouble Halting Target CPU: Internal error)
- I've both tried on CCS5.5 with compiler version 4.2 and a version of IAR where i don't recall the version number from.
- moved back to an development board: EM430F6147RF900
- Disabled SVS & SVM when changing the core voltage. The rise times do differ a bit between 2.5 & 3V DVCC. A rise time of arround 100µs is being noticed)


It would be appreciated if anyone could give me a hint on what i'm doing wrong here.

Code snippet of what is being run (DEBUG is set):

#ifdef DEBUG
/**
* This is run before main with GCC compiler.
*/
int _system_pre_init()
{
/* Stop the WD here for CSS to be able to debug.*/
watchdog_Disable();
return 1;
}
#endif


void main(void)
{

#ifdef DEBUG //repeat for IAR
watchdog_Disable();
#endif
debug_initcheckStackCorruption();

/* Increase PMMCOREV level to 2 for proper radio operation */
SetVCore(2);
...

  • Hi Wouter,

    Wouter Cappelle said:
    I'm using an MSP-FET430UIF usb debugger interface and the JTAG debugger is not powering the board.
    The DVCC is connected through pin 2 back to the debugger for voltage reference. In CSS, i've changed the output voltage from 3 to 2.5V.

    I think this is likely part of your problem. Pin 2 is the pin that is used if you are trying to supply voltage from the debugger. You should disconnect this and connect pin 4 instead if you are trying to externally power your board and provide the voltage for reference back to the FET tool. Please see the Hardware Tools User's Guide www.ti.com/lit/pdf/slau278 figure 2-1 through 2-3 that show how the power connection must change depending on how you are powering the board. For external powered boards, you must use only FET tool pin 4.

    Regards,

    Katie

  • Hi Katie,

    Thanks for your answer. Unfortunately I made mistake in my opening post.

    I've connected pin 4 of the JTAG FET tool towards the VCC of my board. I'm not connecting pin 2 of the JTAG connector as stated in my first post. My apologies for the confusion.

  • If VSense is used to adjust the FET signals to an external supply voltage (Vsense >0V), the FET output voltage setting is ignored. And the FET VCC output must not be connected. If it is, this may lead to oscillations or other weirdness in the supply.
    If, as you said, you don't use the FET supply output, tjhen it might be a problem with you schematics. The FET shouldn’t have any influence. If it has, there might be something wrong on the hardware side.
    If, however, the MSP is under debugger control (so that not only the FET is attached, but also the debugger is active and connected to the MSP), then this might indeed have influence. Like not allowing some deeper LPMs or other effects. I haven’t heard about this kind Vcore problemsbefore, though.

  • It looks nothing to have to do with the VSense input on the debugger.

    Shematics shouldn't be an issue since it's visible on a TI development board. The problem is already visible from the moment we change the VCore to level 2. If I don't step over the code, but just let the code run I notice that the msp is active and running (but I cannot step through it anymore since halting isn't working).

  • One thing I could imagine is that stepping up the first time causes a reset (which breaks the JTAG connection) but then, VCore is already high enough, so that in the second attempt, the code runs through.

    You could run this test:

    In the code, add a global volatile char x=0. Then, after raising VCore, put a while(!x);
    Start the system free-running (will stall in the while), then attach to running target and change x=1.
    Also, you can toggle an I/O pin at start and look at it with a scope (maybe triggered by the rising edge of the RST pin). See whether two pulses appear (first attempt, reset, second attempt).
    It’s just an idea, but I too had some systems where the CPU did a reset on first run and then normally proceeded on the second attempt (on ATMega128)

  • Thanks for your reply.

    I've checked if the msp430 performs a reset when changing the core voltage, but I couldn't find any traces back of resetting itself (with a output pin set , even monitorring the multiple steps to go to the Vcore setting 2).

    Alternatively I went for the approach of attaching the debugger after the step where the Vcore has been set.
    Attaching went fine, but from the moment I step to the next instruction, i get the same behaviour (stepping over a _no_operation() instruction into a while(1) ).

    Any other leads?
    Any change somebody experienced the same on the development board EM430F6147RF900 (Rev4.0), or someone could try to have the same problems I experience?
  • Are you sure you step-up the Vcore level one by one?
    Is there a capacitor of 470nF connected to Vcore?
    Wich MCLK frequency are you using?
  • Hi Leo,

    There is a 470nF capacitor on the VCore pin.

    The Vcore level is indeed stepped up to the required setting. I'm using the hal_pmm library function:

    unsigned int SetVCore (unsigned char level)
    {
      unsigned int actlevel;
      unsigned int status = 0;
      level &= PMMCOREV_3;                       // Set Mask for Max. level
      actlevel = (PMMCTL0 & PMMCOREV_3);         // Get actual VCore
    
      while (((level != actlevel) && (status == 0)) || (level < actlevel))		// step by step increase or decrease
      {
        if (level > actlevel)
          status = SetVCoreUp(++actlevel);
        else
          status = SetVCoreDown(--actlevel);
      }
    
      return status;
    }

    The Mclk frequency is set to the reset values of the UCSCTL* registers (~2MHz DCOClkdiv ). One thing that was getting my attention while looking to these clocks, was that all the UCSCTL registers were read out as '0' when attaching to a running target. Maybe the clock registers are being reset by any reason (I can't explain yet).

  • I had similar problem in the past, but that was on high, 25MHz, clock speed and a wrong Vcore capacitor. The DCO had problems to stabilize and the JTAG connection also gets lost.

    Maybe setting a high Vcore makes the DCO more unstable.
    Try to stabilize with FLL.
  • Still no solution has been found for this issue.

  • Exactly the same problem as you encountered can occur if you are sourcing the MCU from a weak, small, low voltage battery/power supply.

    Maybe the Vcc doesn’t goes below minimum but the, heavily, changes in Vsense to the FET can lead to errors in the FET’s behavior.

    A solution might be to supply Vcc from the FET when debugging, or make Vcc more stable by adding a good quality bulk capacitor. If there is an inductor in the power line than remove it.

  • I've tried to use the internal VCC of the FET debugger to power the board, but I had similar problems when I set the VCC of the target (deliverd by the FET) to 2,5V.
    I've added another 10µF capacitor to stabilize the external Vcc, but this didn't bring any improvement. I've monitored the levels of Vcc, and these look fine while debugging. I'm doing the tests now on the TI development board (EM430F6417RF900), so the HW should be fine I guess.. (no inductor could be found).
  • What happens when you increase Vcc from FET, at which level does it starts to work?
  • I've used an external power supply to find the point of failure.
    3 EM430F6147RF900 identical dev boards were tested.
    I've found out that the boards failed arround 2,68V-2.71V-2.78V (no difference between using SBW or JTAG).

    I also found some EM430F5137RF900 dev boards where I've compiled the same code for. With these boards I get strangely enough better results:
    JTAG: was able to go down to 2.0 V using JTAG as link (didn't try lower values).
    SBW: the turning point varied. For the first board it was arround 2,4V; 2nd board arround 2,3V.

    These test don't bring me any further in understanding what's going on here. PCB layouts/shematics look identical between the both boards (keeping in mind the jumper configurations disabling the step down converter
  • Hi Wouter,

    I do not have an EM430F6147RF900 board here. I do have an EM430F6137RF900 board, and yesterday testing this at 2.5V I saw no issue.

    It is interesting to hear that you saw a differences between the boards. For the F5137 that you mentioned, looking at the CC430F5137 datasheet vcore level 2 requires minimum 2.2V, but it sounds like with SBW you were seeing some issues at a little bit higher than that. I'll see if I can reproduce any issue on the EM430F6137RF900 board when going lower, down closer to the 2.2V minimum for Vcore 2.

    • When the issue occurs, what is the failure mode - is it just that JTAG/SBW loses connection?
      • Does the code on the board still seem to run (for example if you have blinking LED code, does the LED still blink anyway)?
    • Which version of CCS or IAR is used? If you use CCS, can you go to Help > About Code Composer Studio and click the Installation Details button. Then, on the Installed Software tab, scroll down to "MSP430 Emulators" and report the version listed, and in the window at the bottom what MSPDebugStack version is listed if possible? (for example I have latest updated CCS and it says MSP430 Emulators 6.0.1.8 and when I click this the window at the bottom lists: "CI 6.0.1.8 including MSPDebugStack 3.4.3.004"
      • This will tell us the debug stack version that the FET tool is using, in case this turns out to be a problem on the FET tool side.

    -Katie

  • Hi Katie,

    We will use in our final product an 5147@2.1V. According to the datasheet it can run at 2,1V, PmmCoreV=2 & RF operation when lowering the SVSH settings (see recommended Operation Conditions). For now we're using 2,5V.
    i am testing these things on a 6147 since it's a TI development board we have at our disposal which has identical problem behaviour as seen with the real product using the 5147 (custom board).

    Maybe best to test these things on a x417 device if you have one at your disposal?

    What I see when the debugger stops working, is when I hit the pause button while running the code, My debugger stops the program (I can see visually on the board through some leds that they stop blinking - so no more operation), but cannot see which address the msp430 stopped at (It mentions No source available for "0x0" ).

    When I try to flash my project to the target which is running, I get following error:

    MSP430: Trouble Writing Memory Block at 0x8000 on Page 0 of Length 0x276: Could not erase device memory
    MSP430: GEL: File: /home/xxxx/work/TICCS6.0_workspace/TestProject_Vcore_Debugging/Debug/TestProject_Vcore_Debugging.out: Load failed.

    Repeating the debug step usually solves the error (I get the impression the next time the after the "erase" operation succeeded), so I can upload & run my code to the target.

    Version info:

    Code Composer Studio version: 6.0.1.00040
    TI v4.4.2 compiler version
    MSP430 Emulators: 6.0.1.7
    CI 6.0.1.7 including MSPDebugStack 3.4.3.004 - Bugfix Release for CI 6.0.1.6

  • The FET is sensing board Vcc and should adjust his output levels, and the input threshold, to this. Can you see that the FET output signals have an equal (to board Vcc) and stable signal level?

    SBW uses RST, differences in RST-capacitor (or total capacitance) (and resistor) can give different signal sensitivity. Can you see a ‘nice’ RST (TDIO) signal?

    And maybe already pointed to; FET – MCU connection is not longer than ~200mm?

  • Hi Leo,

    I've used SBW @ 2,4V on a failing board. The project 'MSP430 Launch properties' were configured at 2400mV (just in case the sense isn't used in the FET). The signals seem to be stable and are following the VCC of the board: 2,4V SBWTCK & 2,5V for the SBWTDIO line.
    The Rise & fall times are arround 200-460ns for the RST line (SBWTDIO).
    The Rise & fall times for the SBWTCK line are arround 25-30ns.

    As an additional test I've changed the JTAG/SBW Speed in the Target configuration from Medium to Slow, which didn't imrpove anything in behaviour.

    Edit: I'm using the standard cable delivered with the FET debugger of TI (150mm i think)

  • Hi Wouter,

    Thanks for the additional information. To be honest, I was surprised by this note on the CC430 datasheet about using a lower SVSH level allowing Vcc to be lower for Vcorex = 2 - this note is not included on any other MSP43 F5xx/6xx datasheets other than these CC430 devices. I will consult our design teams about this to get more confirmation about why this is listed differently on this part, and if there could be any other condition or setting we could be missing here that is required for running at these lower voltages with vcore = 2 on CCxx parts.

    Wouter Cappelle said:
    Maybe best to test these things on a x417 device if you have one at your disposal?

    Unfortunately the only CC430 boards I found at my location are EM430F6137RF900 and MSP-EXPCC430RF4 which also has F6137 on it. This is why I was having to test with this device. I've reached out to some others to see if they might have a matching board at another site to run the test.

    Regards,

    Katie

  • Thanks Katie,

    Currently the problem already arises for Vcc=2,5V, so it's not linked to the 2,1V which we would run in the final product. But not bad to give us a statement about the usability of this Vcc setting/note.
  • Didn’t know you change the speed.


    The RST timing look suspicious to me, certainly when compared to TCK.

    Do you have another FET to compare with?

  • I got 3 FET's in total. 2 grey ones, 1 black (most recent).
    All 3 of them give the same results in rise & fall times.
    Changing the speed doesn't really affect rise times I have the impression.
  • Hi Wouter,

    1. Do you know if it works when you let the device run in free run without debugger connected. (you can simply add a port toggle after each Vcore increase and trace it with a scope)
    2. Do you have scope shots of the Vcore in free run and in debug mode? I want to see what happens to the Vcore levels.

    Best regards,
    Dietmar
  • I’m nearly out of ideas. But one more question (can’t find it in the conversation), do you use a Cristal?

  • The target is running fine (even at 2,1V with RF enabled) without the debugger attached.
    I compared VCore switching (every 50ms) between debugger attached, and not attached, and both levels are looking compareable.
    1.4V->1.8V (with 1,6V during transition from 0->2)
  • A 32kHz crystal is installed on some of the dev boards (2/3), but not used. On the product, there is no crystal.
    The standard clock settings are used (reset values). I've played a bit with the clock, but couldn't see any difference in that area.

    Edit: On the 5137 dev boards I've used in previous replies, there are 32kHz crystals soldered on all of them, but not used.

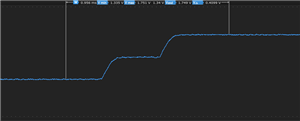
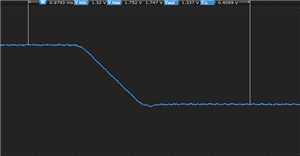
  • I  could make some transition graphs. Analyze them with care since they were taken with a device which hasn't been calibrated.

    I took a calibrated scope for the levels 1.4-1.8V & spike analysis, but it's currently not at my disposal.

    Vcore 0 -> 2 transition (debugger attached)

    Vcore 2 -> 0 transition (debugger attached)

  • Hi Wouter,

    thanks for additional details the Vcore increase, it looks pretty good, no drops or spikes which might cause a RST triggered by the low site supervisors.

    To check my understanding;
    You said that without debugger connected everything is working fine, right?
    Only with debugger attached you see that you loose JTAG connection/control after the Vcore level is set to 2?

    The difference between JTAG connected/disconnected is that the PMM is slightly different powered with JTAG connected. So is it possible to disable the low and high site SVS/SVM and check again if you loose control. This is more to get a handle on what disturbs your JTAG control.

    You said your debugging stopped while increasing to Vcore=2. How you can record the Vcore 2->0 transition with debugger attached? Is this due to RESET of the device? If my assumption is right this tells us that you really see a BOR because the PMMCOREV bits were only reset by BOR not by POR which is triggered by SVSH.

    Would it be possible to check the SYSRSTVEC in your code at the beginning to find out what reset source triggers reset all the time?

    Best regards,
    Dietmar
  • Hi Dietmar,

    Everything seems to work fine without the debugger as mentioned in my earlier replies.
    The debugger only starts doing strange things when going to VCore 2. On setting 1, I could successfully step through the hal_pmm code.
    This is a test I've already done before. I tested this with toggling some pins with a scope which reflect the VCore setting i'm in. I couldn't notice a BOR/POR (since I did a reset on a different signal which I monitored). Also SVSH & SVSL are not enabled during normal operation. They are only used to change the core voltage.

    I notice that I lose connection while stepping through the hal_pmm code. Immediately after changing the VCore to 2:
    // Set VCore to new level
    PMMCTL0_L = PMMCOREV0 * level;
    // Wait until new level reached
    if (PMMIFG & SVMLIFG)
    while ((PMMIFG & SVMLVLRIFG) == 0);

    While stepping through, I get to the instruction if(...), but when I want to step to the next instruction, Nothing happens anymore and I get a error:
    "MSP430: Can't Single Step Target Program: Could not single step device"
  • Hi Wouter,

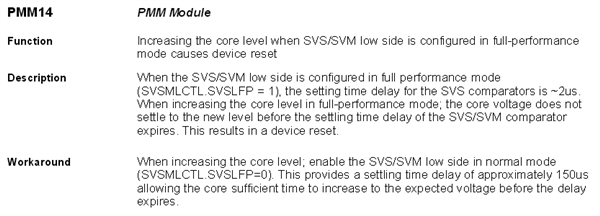
    I think I found the problem. If you take a look to the ERRATA sheet please check PMM14 which tells you following:


    When you have JTAG connected the SVSL is automatically in full power mode which might cause issues while you increase the Vcore when debugger is connected. This is one of the main differences between free run and debug.


    Can you please disable the Low Site SVS/SVM in the Driver Lib function and try again. Please let me know if this helps to fix your debug problem.


    Best regards,
    Dietmar

  • Hi Dietmar,

    Thanks for  your reply. I've tried the above workarround, but wasn't succesfull in solving the root cause.

    In the past I also didn't see a BOR/POR on the ouptut lines I monitored, so I don't suspect there is a reset killing the connection.

    I also can reproduce the problem when I set the VCore to 2, at 3DVCC, and then changing in runtime to 2,5DVCC while trying to hit a breakpoint. The moment I reach the turning point, the JTAG connection is lost. At that point, there is no Low site SVS/M running/enabled and the Vcore is already at it's settling point.

  • Hi Wouter,

    I reproduced this behavior with CC430F6147 RevE on my bench. I also tried a CC430F6137 and this device worked fine under debug control.
    I contacted our tools experts for detailed look into the debug stack. Can you please let me know which msp430.dll you use?

    I also confirmed that Vcore increase worked down to 2.0V without JTAG connected.

    Best regards,
    Dietmar
  • Hi,

    Good to hear I'm not chasing ghosts here.

    Not sure what you want me to look up, but I assume this is what you're looking for:

    CI 6.0.1.7 including MSPDebugStack 3.4.3.004 - Bugfix Release for CI 6.0.1.6

    Other versions of installed Software:

    MSP430 Compiler Tools 4.3.6 com.ti.cgt.msp430.4.3.linux.feature.group Texas Instruments
    MSP430 DriverLib (IDE Client) 1.97.0.19 com.ti.mcu.msp430.driverlib.product.ui.feature.group Texas Instruments Inc.
    MSP430 DriverLib (Target Content) 1.97.0.19 com.ti.mcu.msp430.driverlib.product_1.97.0.19.feature.group Texas Instruments Inc.
    MSP430 Emulators 6.0.1.7 com.ti.ccstudio.msp430.emu.linux.feature.group Texas Instruments
    CCSv6 Service Release Linux 6.0.1.00040 com.ti.ccstudio.installer.linux.feature.group Texas Instruments
    MSP430 Compiler Tools 4.4.2 com.ti.cgt.msp430.4.4.linux.feature.group Texas Instruments
    MSP430 GCC Tools 4.9.1.20140707 com.ti.gcc.msp430.linux.feature.group Texas Instruments
    MSP430_CGT_Help_Feature 4.3.0.201401241632 com.ti.cgt.msp430.4.3.help.feature.group null
    MSP430ware (IDE Client) 1.97.0.47 com.ti.mcu.msp430ware.product.ui.feature.group Texas Instruments Inc.
    MSP430ware (Target Content) 1.97.0.47 com.ti.mcu.msp430ware.product_1.97.0.47.feature.group Texas Instruments Inc.
    MSP430Ware for Linux 1.97.0.47 com.ti.msp430.msp430ware.linux.feature.group Texas Instruments

    I hope this tells you more than it does to me :-)

  • Hi Wouter,

    I would like to share an update with you. We discussed this behavior with our design team and based on their input it should not be related to silicon.

    We also had discussions with Tools team and even on this side no obvious issues were found. We will do low level debug analysis next week to better understand which part DLL, Tool or the silicon will cause the behavior.


    Best regards,
    Dietmar

  • Hi Dietmar,

    Thank for the update!

  • Wouter Cappelle said:
    According to the datasheet it can run at 2,1V, PmmCoreV=2 & RF operation when lowering the SVSH settings (see recommended Operation Conditions).

    While this is obviously not related to the main problem, I want to discourage you to use this hack.

    As I read the not, it is not there as a hint to do it but as a warning not to do it.
    While the RF part requires 2.0V to run, the CPU core requires PMMCOREV_2 for radio operation. Now PMMCOREV_2 requires 2.2V.
    As I see it, this note basically tells you that you could set the core level to 2 even with VCC=2V when disabling the high-side SVS or lowering its settings. But then the LDO might work outside its spec (and therefore fail to provide the required core voltage) and the core voltage will still be monitored by the low.side SVS (and therefore trigger a reset), so you should not try to fool the system.

    Since the radio core and the MSP430 core are two independent pieces of silicon, the radio core's minimum requirements are lower than the minimum requirements of the CPU. simply raising the radio minimum voltage (in the datasheet) to 2.2V would have prevented this uncertainty. Better be safe than sorry and go for 2.2 or even 2.3V. It will also give you some headroom regarding radio output power. If really going for 2.1V, you're walking on thin ice.

    Only the CC devices have the radio part, so no wonder this note does not appear in any of the F5x/F6x datasheets which basically use the same CPU core. Nobody would even think about such a trick there.

  • Thanks for this warning/heads-up.

    It only makes me wondering why this warning hasn't been mentioned in the datasheet then (or why this setting is even mentioned to start with)?
    I would imagine that such settings don't come in a datasheet without thorough testing and be sure the device can work with it in a perfect way?
    For our product we'll re-evaluate the 2,1V in favor of 2,2V if this would give us stability problems.

  • All,


    the datasheet mention that it should work except the limitations mentioned in the note. It's on CC430 devices only because it's a special requirement for the RF part. I think it was confirmed by TI and by you as well that in free run mode (not under JTAG controll or in debug) the device will work down to 2.0V with Vcore=2. So no problem for operation under application like conditions up to now it seems to be related to DEBUG "only".

    I did more internal debug on this up to now and found that the JTAG connection did not completely get lost if Vcore is increased to LVL=2 under debug control at DVCC < 2.5V. It's still possible to access the JTAG 3V registers which tells us no internal RESET appeared.

    Actual I really look into device internal synchronization signals to find out why it is not working at voltages below 2.5V on CC430F6147. As mentioned before on CC430F6137 and F5438A it's working as expected.


    Best regards,
    Dietmar

  • Thanks for your reply & status Dietmar.

    Could you also make an official TI statement if it is safe to run at DVCC 2,1V with radio operation enabled in free run mode? This is important to know and if it's not a safe setup. I could not make up from your reply if this is now a potential problem for other devices, or not.

    Thanks in advance

  • Wouter,

    the behavior you've seen seems really to be a "debug only" related problem most probably caused by wrong internal interface signals between PMM and UCS causing the debug issues. We really work on this to check what's going on. From my point of view I really cannot 100% confirm that this is only debug until I have understood the whole scenario in detail.

    But based on our experiments and knowledge as of today I can confirm the device will operate according specifications under the official “TI’s Terms and Conditions of sale of semiconductor products” conditions if it runs in free run mode at DVCC 2.1V.

    Best regards,
    Dietmar
  • Could you give me an update on the investigation of this problem? I didn't see any more updates lately. Any progress on a root cause & solution?
  • Hi Wouter,

    I want to reassure you, I have seen there is still a lot of work being done investigating this internally on our side. I'm really sorry it's taking so long - I do see this is making progress behind-the-scenes, we just don't have a final answer for you just yet. We'll definitely let you know as soon as we have this resolved, and I want to thank you again for finding it in the first place and bringing it to our attention.

    Regards,
    Katie
  • Katie,
    first thanks for jumping in during my urgent absence.

    Hi Wouter,
    we made further progress on debugging this issue and we can provide more information but we need to take this offline.
    I will contact you via email to complete this case.

    Best regards,
    Dietmar

  • "we need to take this offline"
    Too bad, as he is likely not be the only one facing this problem sooner or later.
    Even the Chronos likely is affected by this, once battery voltage goes down (in which case most users simply replace the battery, while solving the problem could extend battery life)

    I hope any final solution (or authoritative explanation) is posted here.

**Attention** This is a public forum