This thread has been locked.

If you have a related question, please click the "Ask a related question" button in the top right corner. The newly created question will be automatically linked to this question.

MSPWARE: What's the difference of DeltaTOF caculate between water and air in USSLib?

Part Number: MSPWARE

Hi,

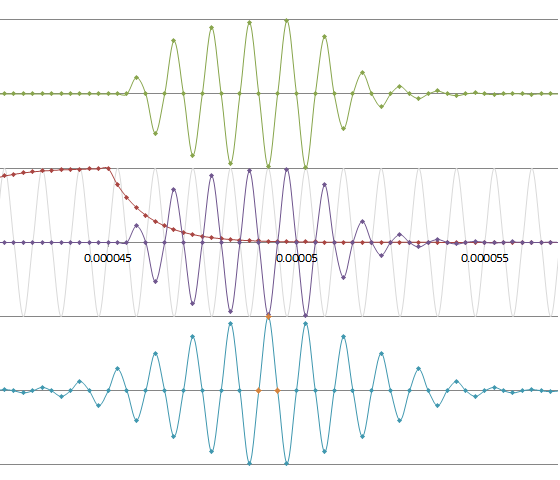
I have a question about the difference of DeltaTOF caculation between water and air in USSLib. I'm trying to understand how the caculation of air flow works. I try to analyze the USSLib by a program flow generate tools in IAR. The DeltaTOF_estimate seems to have no behavior on finding the MAX value of the cos-interpolate results(it does not need to run USS_calculateMax as DeltaTOF_water does). This makes me confused. Is there any special reason for this? Can someone tell me the exactly difference of DeltaTOF caculate between water and air in USSLib?

What's more, a window seems to be add to the samples(through USS_generateWindow and USS_runWindow), which was not described in user manual. Why do we need the window? What is it used to do?

  • Dear customer,

    sorry for the delay in our response. Our expert will contact you tomorrow.

    Best regards

    Peter

  • Hi Simi Wang,

    a detailed answer on that topic goes far beyond what is possible in this forum; We've got apps reports and white papers about those topics that go a bit deeper.

    Correlation is used on both. And a full correlation over all AD converted points would work for liquids and gas. The energy budget however does not allow to correlate over all points. You would need to select your search range you are looking at. For liquids things are easier in some aspects. Liquids cannot be compressed. The attenuation of the signal is low. The frequency range of the transducers are much higher than typical environmental noises. The code for this you have seen...

    On gases on the other hand you get signal envelopes that look "much uglier". You've got low signal readings, signal fading if the flow rate changes, and environmental noises make it into the transducer's operation range. All that requires more signal conditioning before the correlation starts. On top the chosen approaches have to be power efficient.

    Johann

  • Hi,

    Thank you for your reply. It inspired me a lot. Just one more questions.

    There seems to be three difference correction functions, USS_corr USS_corr3 and USS_corrN, what's the difference between them?

  • Hi Simi Wang,

    Are you asking about the three different setting of the USS_highFlow_options?

    The different between those three settings is we using different threshold to calculate the flow rate. We now highly recommended customer to switch to USS_ALG_DELTA_TOF_COMPUTATION_OPTION = USS_Alg_dToF_Calculation_Option_estimate.

    Best regards,

    Cash Hao

  • Hello again Simi Wang,

    correlations are used for various functions of the USSLib. Most popular is the 3pt correlation for exact DelataTOF calculation.

    In the graphic above you see...

    • the greenish curve: representing the ping response downstream
    • the purple curve: representing the ping response upstream
    • the blue curve: the full correlation of greenish and purple applying a limited time shift around zero
    • the orange points on blue are the selected points on the 3pt correlation

    The above situation shows zero DTOF; on transducers with 1MHz and sample frequency of 4MHz. The middle orange point is aligned to zero time shift, left point is 1 sample left shifted, right point is 1 sample right shifted. Since we've got zero DTOF the whole thing is symmetric.

    Correlations are highly time and energy consuming therefore only the minimum amount of points is calculated, here three. And this is enough to cover time shifts from +/- some hundred nanoseconds at 1MHz transducer frequency.

    The 3pt correlation receives a two series of 12bit sample values from the ADC captured upstream and downstream. It returns three results with a numerical significance of more than 19..21 bits (given enough samples, on proper setup). These results are then used to exactly calculate the dTOF that is used to calculate the flow rate.

    The second graphic shows the case with 10ns right shift of the purple curve; you see that the three correlation points are not symmetric anymore.

    Have a nice day

         Johann   


  • Hi Johann,

        Thank you so much, this solve my question.

**Attention** This is a public forum