This thread has been locked.

If you have a related question, please click the "Ask a related question" button in the top right corner. The newly created question will be automatically linked to this question.

MSP430FR50431: Unusual, periodic noise in ToF Diff measurement on water meter design

Part Number: MSP430FR50431

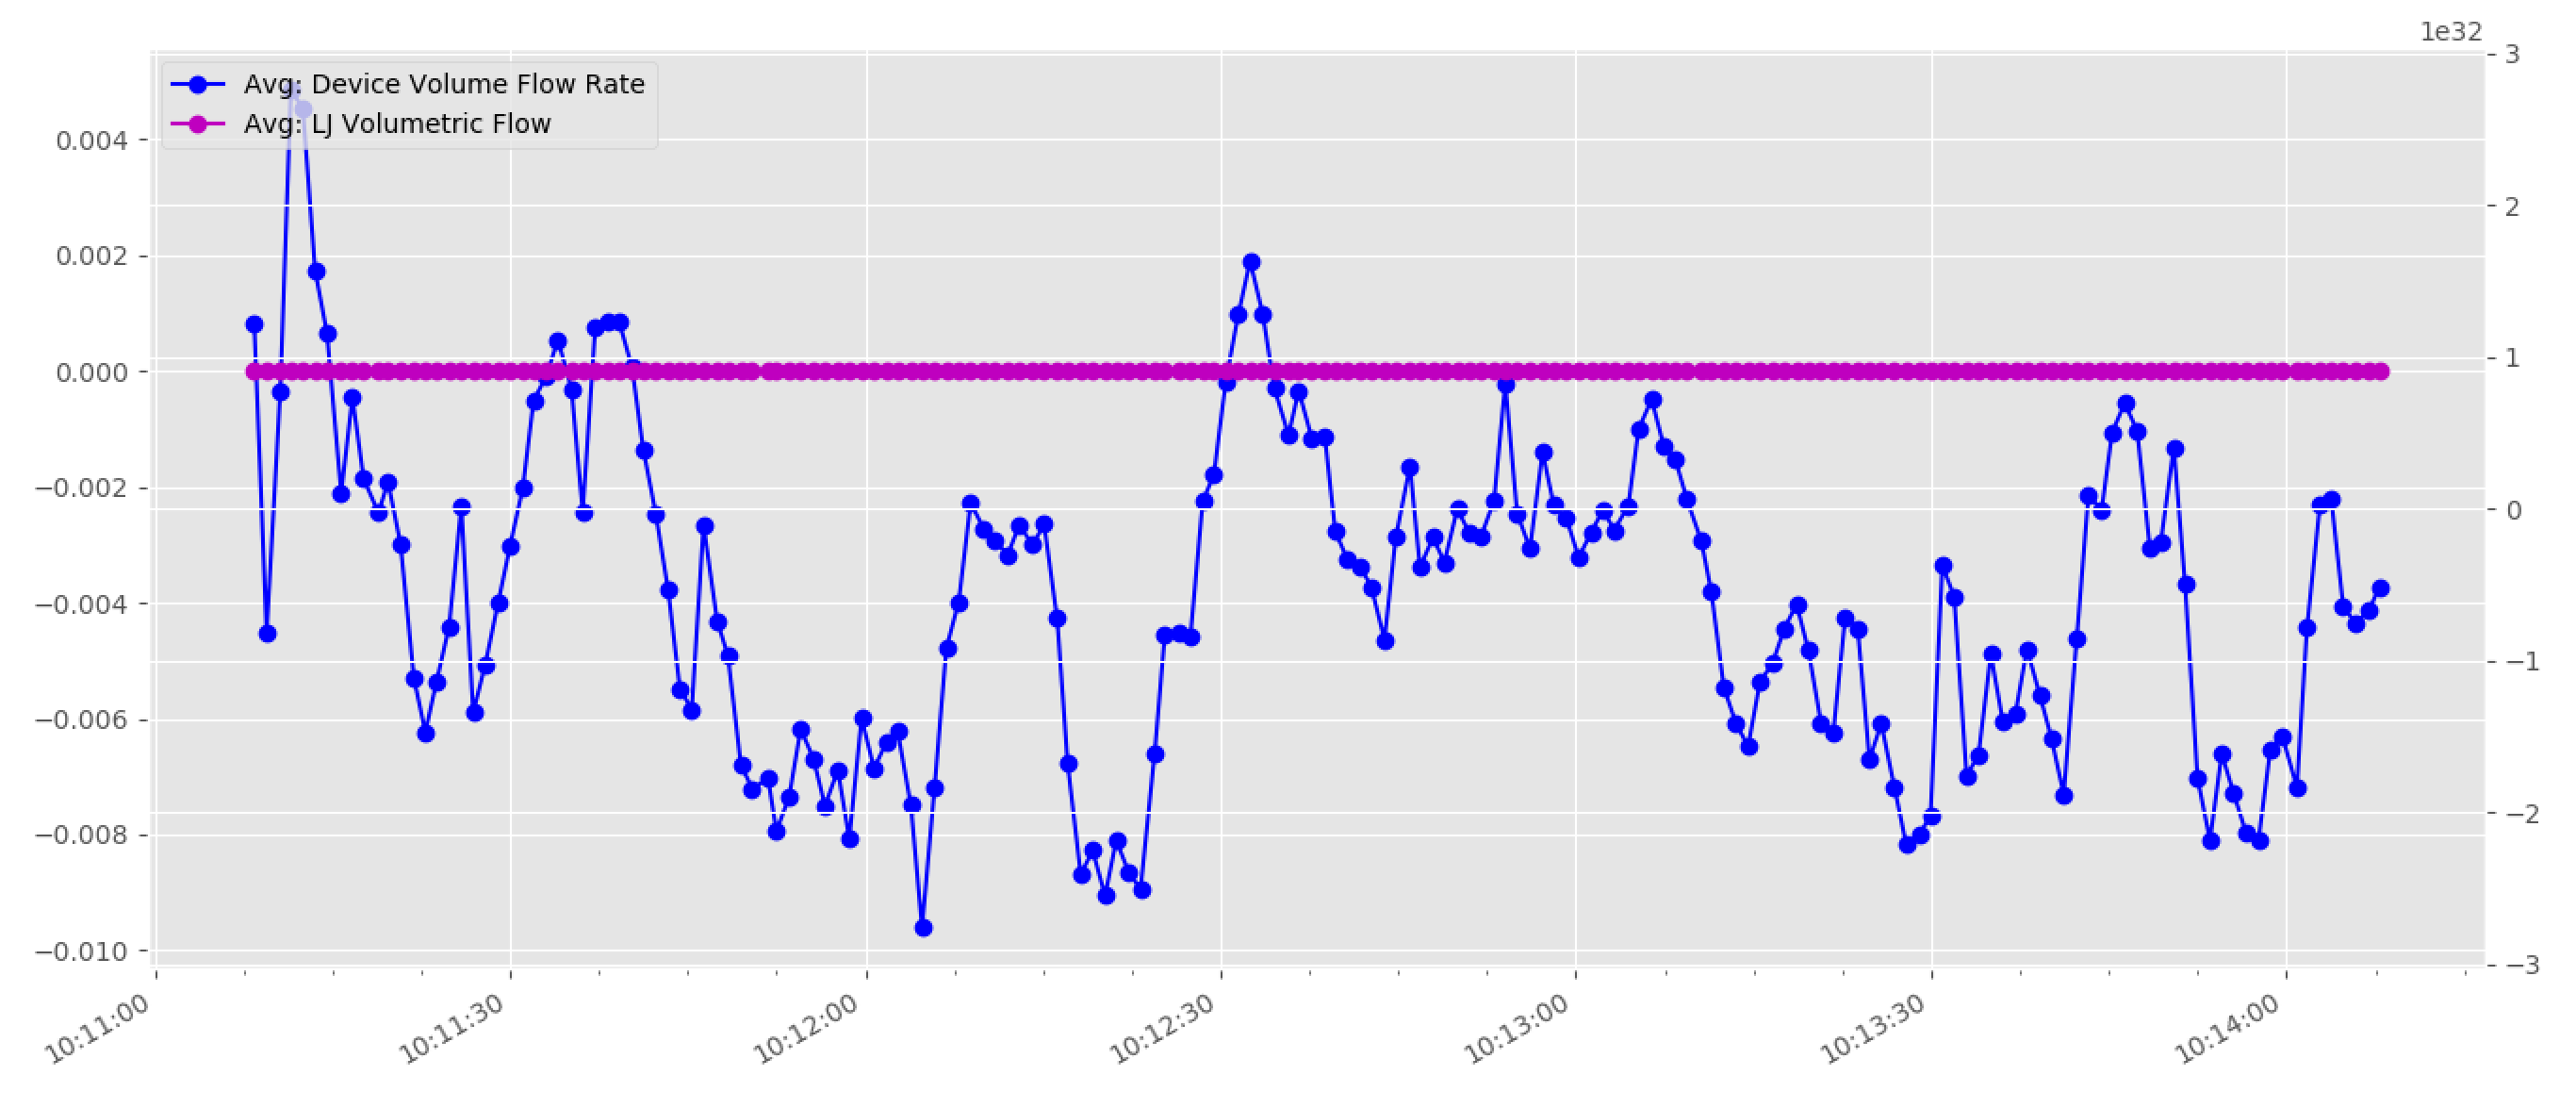
I'm hoping someone may have insight into a problem we're seeing.  We seem to get a small, but repeating oscillation in our ToF measurements.  It's not perfectly repeatable but does seem to show up a lot.  Please see plot below of a sample flowrate measurement taken every second for 3 minutes.  Blue is a 10 point moving average of the VFR from the MSP.  Purple is the measured flowrate on a calibrated magmeter, also with a 10 point moving average.

It seems to cycle every 15-30 seconds or so.

Has anyone seen this kind of behavior before?

  • Hi,

    I expect this to be related to the actual flow itself.

    Please note that the magmeter inherently reports a flow measurement that "is proportional to the mean flow velocity" while the ultrasonic reports an "instantaneous" measurement of the flow rate. There is no averaging done by the ultrasonic flow measurement. That is the reason you see a "smoothed" flow with the magmeter and a more varying flow measurement with the ultrasonic.

    Srinivas

  • Hi Srinivas,

    Thanks for your quick reply. That does make sense. I took a couple captures at zero flow, below:

    Is this the level of noise you would expect to see in a water meter application at zero flow?

  • Hi Brad,

    The standard deviation of the delta time of flight (DToF) measurement under zero flow conditions is typically around 35 ps without any averaging. You can see this in Figure 25 on page33 of the water flow meter reference design at http://www.ti.com/tool/TIDM-02005 -> http://www.ti.com/lit/pdf/tidues5. This can vary to a certain extent from device to device, the transducer pair and also the pipe/meter body design. For a DN20 pipe, that is equivalent to approximately 0.5 LPH or 0.003 GPM.

    The units of the plot you posted above are not clear but the standard deviation looks to be around 0.003 units. But if you are averaging over 10 measurements, the single measurement standard deviation is 0.01 units. If that is in GPM, I would think it is higher than what we expected. If it is a different pipe diameter, the expected standard deviation of each measurement will also be different.

    Srinivas

**Attention** This is a public forum