This thread has been locked.

If you have a related question, please click the "Ask a related question" button in the top right corner. The newly created question will be automatically linked to this question.

CCS/TM4C129ENCPDT: Debugging is not getting stopped at breakpoints

Part Number: TM4C129ENCPDT
Other Parts Discussed in Thread: SEGGER

Tool/software: Code Composer Studio

Hi, 

I am using ti rtos and ccs version 9. After connecting j link segger to my board, I am starting the debugging process. But, when I set the break points, my program is not grtting stopped at the breakpoints. Rather than it is keep running. 

What can be the problem?

thanks

  • The most common reason is that your code is not executing as you expect and has not tired to execute the instruction where you placed the breakpoint. After you load the program (program it into flash) does the debugger stop at main()? If so, that is a breakpoint that worked. Can you provide more details?

  • Hi,

    Yes, it was stopping at main only.

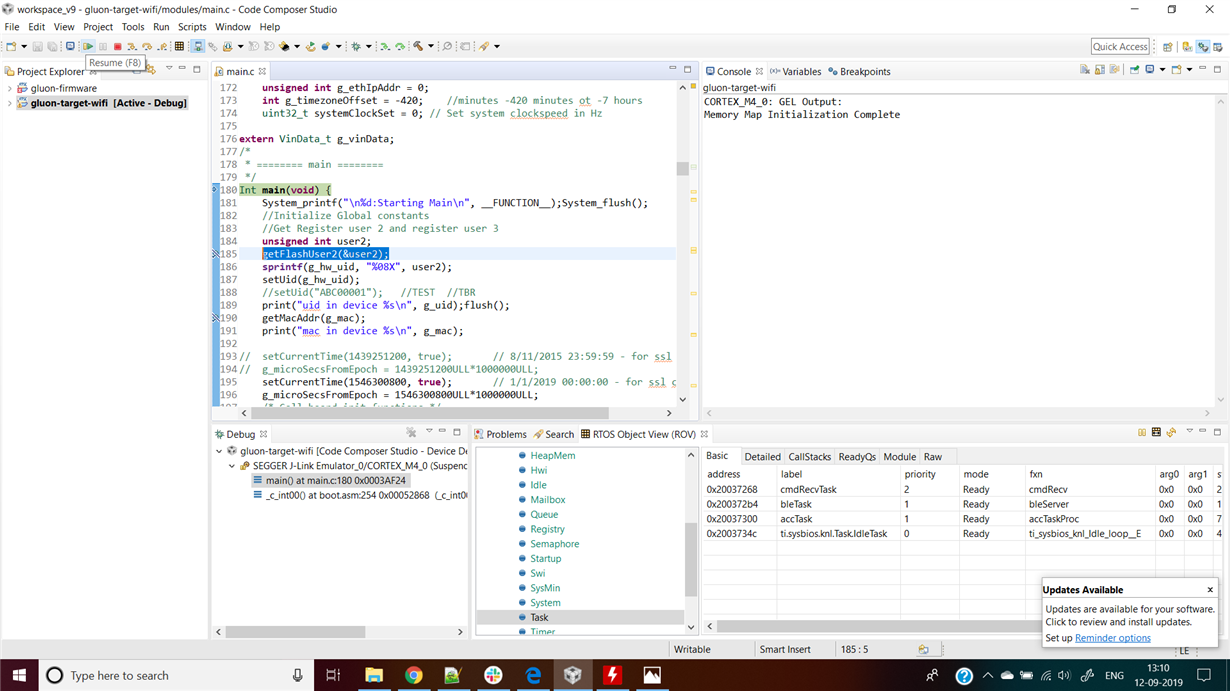
    As you can see, I have the breakpoint on L. no 185. When I am doing step into/over, it is working. But when i press resume. the whole code started to execute without getting stopped at breakpoints. 

    Please check.

    Thanks


  • You actually do not have a breakpoint on line 185. Look at the image closely. The breakpoint symbol with the line through it means that it could not set a breakpoint associated with that line of C code. Most likely because the optimizer was able to remove that function call. 

    Here is what your image looks like:

    Here is what a successful breakpoint looks like:

    You can disable optimization, or you can use the disassembly window to see what the code is actually doing. Your function may resolve to a simple assignment.

  • Is it 'fair to note' that the 'Breakpoints' (post above) prove (barely) notable?'       (a possible effect of the over-arching 'style-guide' - is that not so?)

    Bit hard to 'blame poster' for not 'immediately recognizing' such 'important'  yet  (low contrast afflicted) markers - many would conclude.

    In contrast - a 'Pro IDE' presents a 'far more effective' means - to insure user recognition of  Breakpoints!     Motion and (then) 'COLOR'  - are well recognized by the human eye!    (Not so  'Shades of Grey' - even if - and especially if - they stand (even) '50 grey shades' strong!)    (how many here will 'get' this?)

    Note: this from an extremely rare 'LX232' (BGA) MCU Eval Board - gifted my firm by vendor...

  • Yeah.. Breakpoints should be highlighted. Please take note. 

  • Agreed - 'hiding/diminishing' such vital feedback makes (pardon) 'little sense!'

    Might you (properly) award GREEN (Verify) to the 'Highlighting' posting as well?

  • I am forwarding your good suggestion to improve how breakpoints (and non-breakpoints) are highlighted to the Code Composer Studio team.

  • Greetings and thank you.

    As my investors have long taught,  "Most always provide a 'workable alternative' - when noting 'inefficiencies!'     I believe that I've complied nicely w/their directive.

    It may be noted as well - that the use of 'COLOR' and/or other highlights - proves especially useful - throughout your publications. 

    For example - the (unexpected) implementation of (famed) '123 Eval's 'Plague-Istors" (R9 & R10) iirc - displayed in (just beyond) well blended, mice-type - surely would benefit from (some) emphasis - don't you agree?

    Not all here are equipped w/'eagle eyes' - expecting users to 'wade thru (almost) endless pages' - minus 'normal/customary' highlighting - has too often resulted in your (very sound) guidelines - passing unrecognized!      That cannot be good!

    Note too that such highlighting - employed so often in 'Mission Critical' applications - helps to 'Steer the reader'  to the most eventful elements - better insuring their notice.     And that - in contrast - is good - is it not?

  • Hi,

    Our current approach is to deviate the least from the Eclipse standard color scheme, given that CCS allows attaching a plethora of other debuggers to its IDE - users of application processors navigate across GDB and CCS debug quite frequently and we are trying to maintain consistency. 

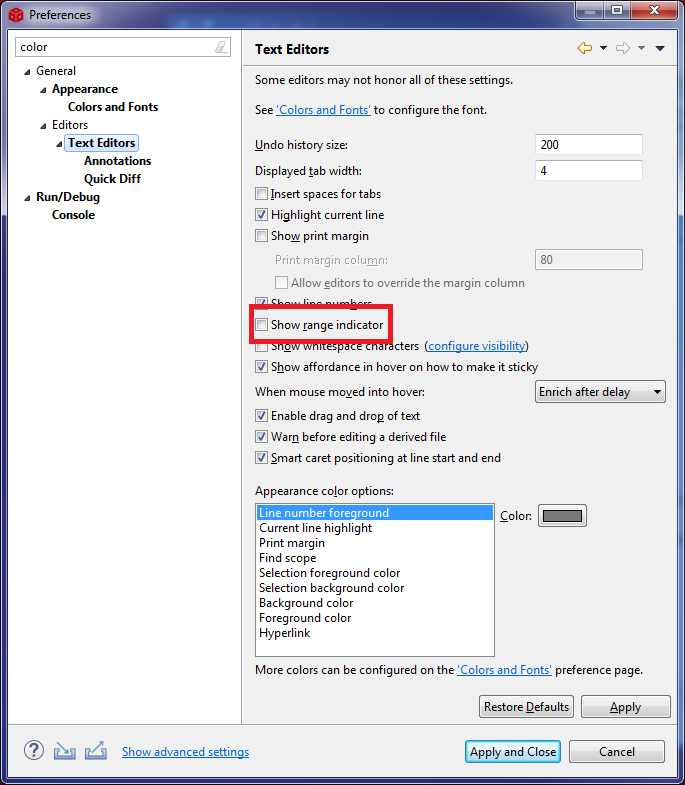
    The current workaround is to disable the range indicator in the Editor view. Please try the option below on the CCS Preferences (menu Windows --> Preferences).

    At any rate, the change in the color scheme is being taken under consideration.

    Regards,

    Rafael 

  • desouza said:
    Our current approach is to deviate the least from ...

    Thank you - yet that 'current approach' appears flawed - as clearly revealed.     Can the goal to, 'Deviate the least' (really) be justified - when it causes, 'User pain & frustration?'     Should not 'Client Ease & Comfort' receive 'far 'higher' consideration?

    Do note that firm/I are 'Multi-Seat (paid) Users of the PRO IDE - 'IAR' - as we (necessarily) deal w/ARM MCUs from multiple vendors - thus a 'Vendor Agnostic Approach' proves our ONLY choice.    (Due to IDE consistency & top-cabin performance - across multiple vendors' devices...)

    Can it be 'accepted' - that this specific poster - and many/most others - repeatedly suffer from such (known) IDE 'Shortcomings.'    It is certain that most will 'miss this posting' - and even if noted - (very) few are likely to expend the required effort - to adopt your 'Current Approach.'    

    As noted earlier - this 'lack of 'EYE CAPTURE' flows far outside your IDE.   Numerous publications would benefit - pages & pages of 'constant color & consistent text' - prove monotonous - tend to 'absorb - rather than illuminate - your  Key Points!' 

    As well noted - a proper alternative DOES EXIST!      Promoting  an ineffectual approach - even when deemed 'current' - especially when deemed 'current' - is unlikely to fully/properly satisfy (reasonable) user needs & expectations!