A related question is a question created from another question. When the related question is created, it will be automatically linked to the original question.
If you have a related question, please click the "Ask a related question" button in the top right corner. The newly created question will be automatically linked to this question.
Sorry I did not understand your question and what exactly you mean by curve analysis? I can not see the curve very clearly if possible can you please attach the figure in a file/document form and label it also (what is x-axis and y-axis?)
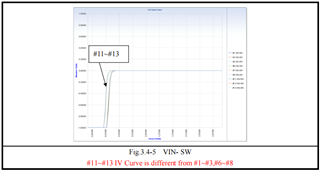
Thanks for your reply. Sorry I did not describe clearly. First figure, x-axis is the force Voltage between SW(Pin4) and GND and y-axis is the corresponding Intensity. Second figure, x-axis is the force Voltage between VIN and SW and y-axis is the corresponding Intensity.