This thread has been locked.

If you have a related question, please click the "Ask a related question" button in the top right corner. The newly created question will be automatically linked to this question.

TPS2HB35-Q1: Transient Thermal impedance chart in the datasheet

Part Number: TPS2HB35-Q1

Hi team,

My customer want to apply accurate characteristics into his thermal simulation.

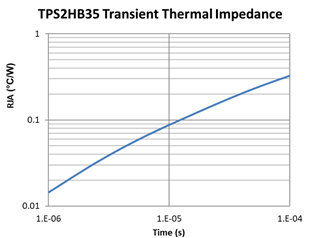
I know it's almost zero but, he needs the value in 1us-100us range.

Could you change the Y-axis from Linear to Log scale for Figure 3 and 4 and provide it?

Best Regards,