This thread has been locked.

If you have a related question, please click the "Ask a related question" button in the top right corner. The newly created question will be automatically linked to this question.

UCC28950EVM-442: UCC28950EVM-442

Part Number: UCC28950EVM-442
Other Parts Discussed in Thread: UCC28950,

Hello,

I would like to contact you as a trainee power electronics engineer at SERMA Ingénierie, to ask you for more technical explanations and more details about a test you have performed on an evaluation model of a 600W Phase Shift Full Bridge DC-DC power converter with an UCC28950 controller.

The test I am talking about is the one on page 18 of your Texas Instruments test document, after reproducing the same test, I do not get the same results as you did.

I would like to ask you please to explain me more in detail where the problem could come from?

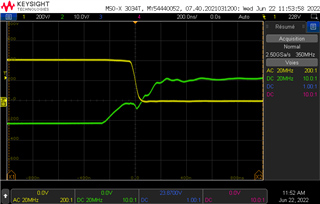
Please find attached my result and yours.

I remain at your disposal for any further information.

Best regards.

The test carried out by SERMA Ingénierie

  • Hello,

    Is your load at 25 A like figure 18? 

    When I look at this waveform it looks like the switch node has transitioned 98% from it's maximum to it's minimum before the gate drive is initiated.  You can see a slight miller plateau due to the FET not being fully off.  If you increase the load you should see the miller plateau disappear and it will more resemble what you are seeing in figure 18.

    Figure 15 through 20 shows the switch nodes of the A and B and C and D FETs from 10% load to 100% load.  Have you reviewed all the test conditions?  It should be similar to what was presented in the user's guide.  However, do to process variation in FET capacitance ZVS will vary slightly based on loading, however, it will still have similar behaivor.

    Regards,


  • Hello,

    The test that I am asking you to provide more explanation on please, is the one represented on figure 20 page 18. I have performed the same ZVS test in full load (100%) but I can't get the same results as what you have got.

    Best regards.

  • Hello,

    The waveform you took is very close to figure 18.  If  you increase the load you should eventually achieve what is presentenced in figure 18. 

    As mentioned earlier ZVS will vary based on variations in the switch node capacitance.  One of the major contributors to switch node capacitance is Coss.  This will vary from FET to FET.  Somewhere between 25 to 30 A I would expect that switch node to achieve ZVS.

    If you want to achieve ZVS at lighter loads in your design you will need to increase the shim inductance (Ls).  The following will bring you to an application note that discusses how to size Ls to achieve ZVS at lighter loads.  https://www.ti.com/lit/pdf/slua560

    Regards,

  • Hello,

    I think we misunderstood each other, the test I performed, it was done at an input voltage Vin=390V and an output load of 47A. So, as I am in nominal sizes but I do not reach the ZVS, it means that a problem is somewhere!

    Best regards

  • Hello,

    Was anything changed in the design?

    This EVM was released back in 2011 and was designed to achieve ZVS at 25% to 100%.  The UCC28950EVM-442 user's guide showed the EVM performance. 

    Regards,

  • Hello,

    NO, nothing has been changed on the design. It is the same model of UCC28950EVM-442.

    Best regards

  • Hello,

    Try taking the measurements tip and barrel.  Also check your load current to make sure it is 47 A.

    Regards,