Other Parts Discussed in Thread: TPS563212, TPS562212, TPS54332
Hi team,
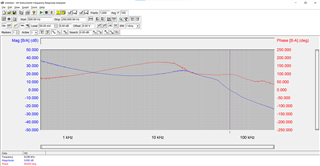
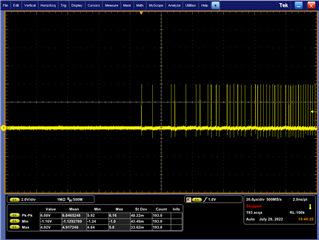
I've measured a bode plot of TPS563240 but the result showed very strange and noisy that I cannot understand.
Have you seen a bode plot like below? If yes, how to improve to get the right bode plot?
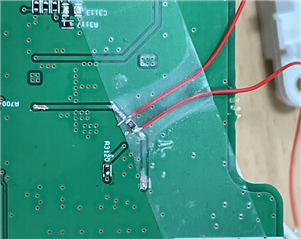
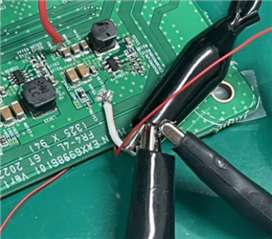
I've also connected Cpass which is parallel to injection resistor but didn't improve the issue.
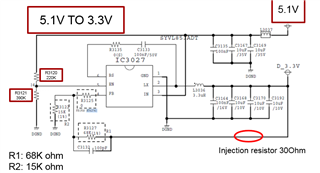
Customer's spec:
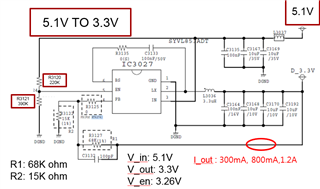
- V_in: 5.1V
- V_out: 3.3V
- V_en: 2.8V
Customer's SCH:
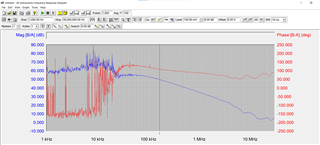
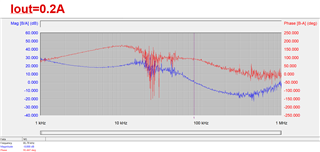
When I draw 0.2A for output current, it is reasonable as below:
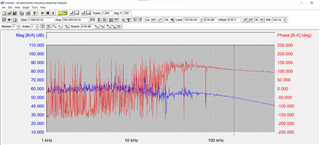
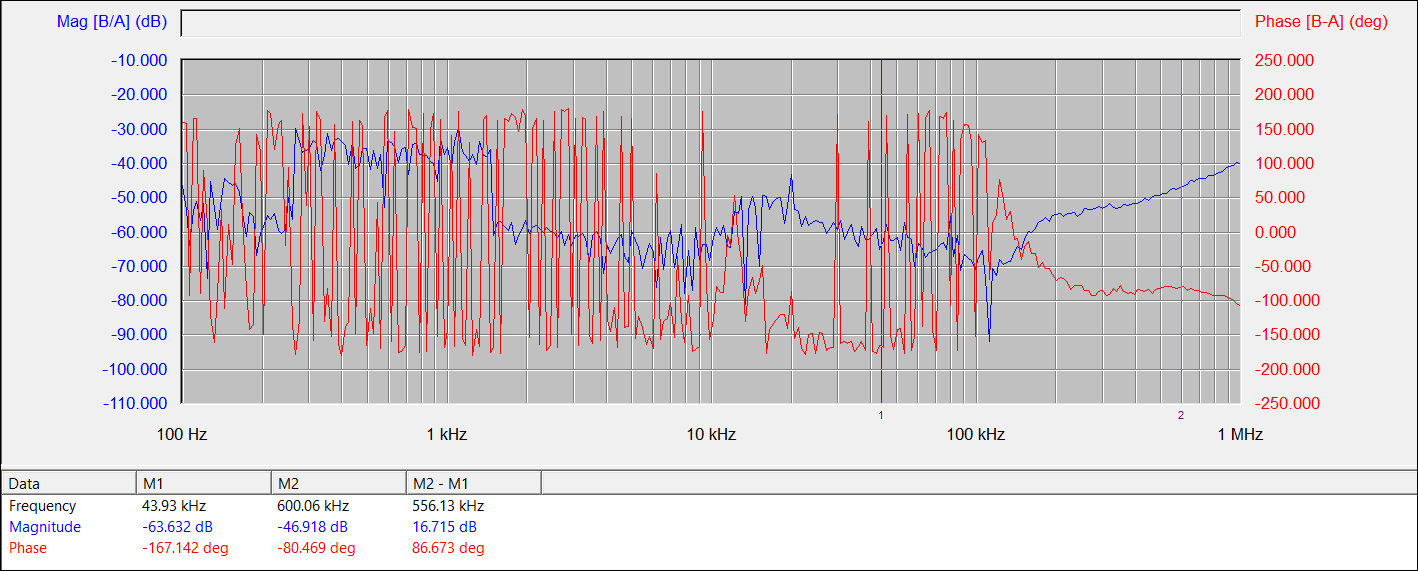
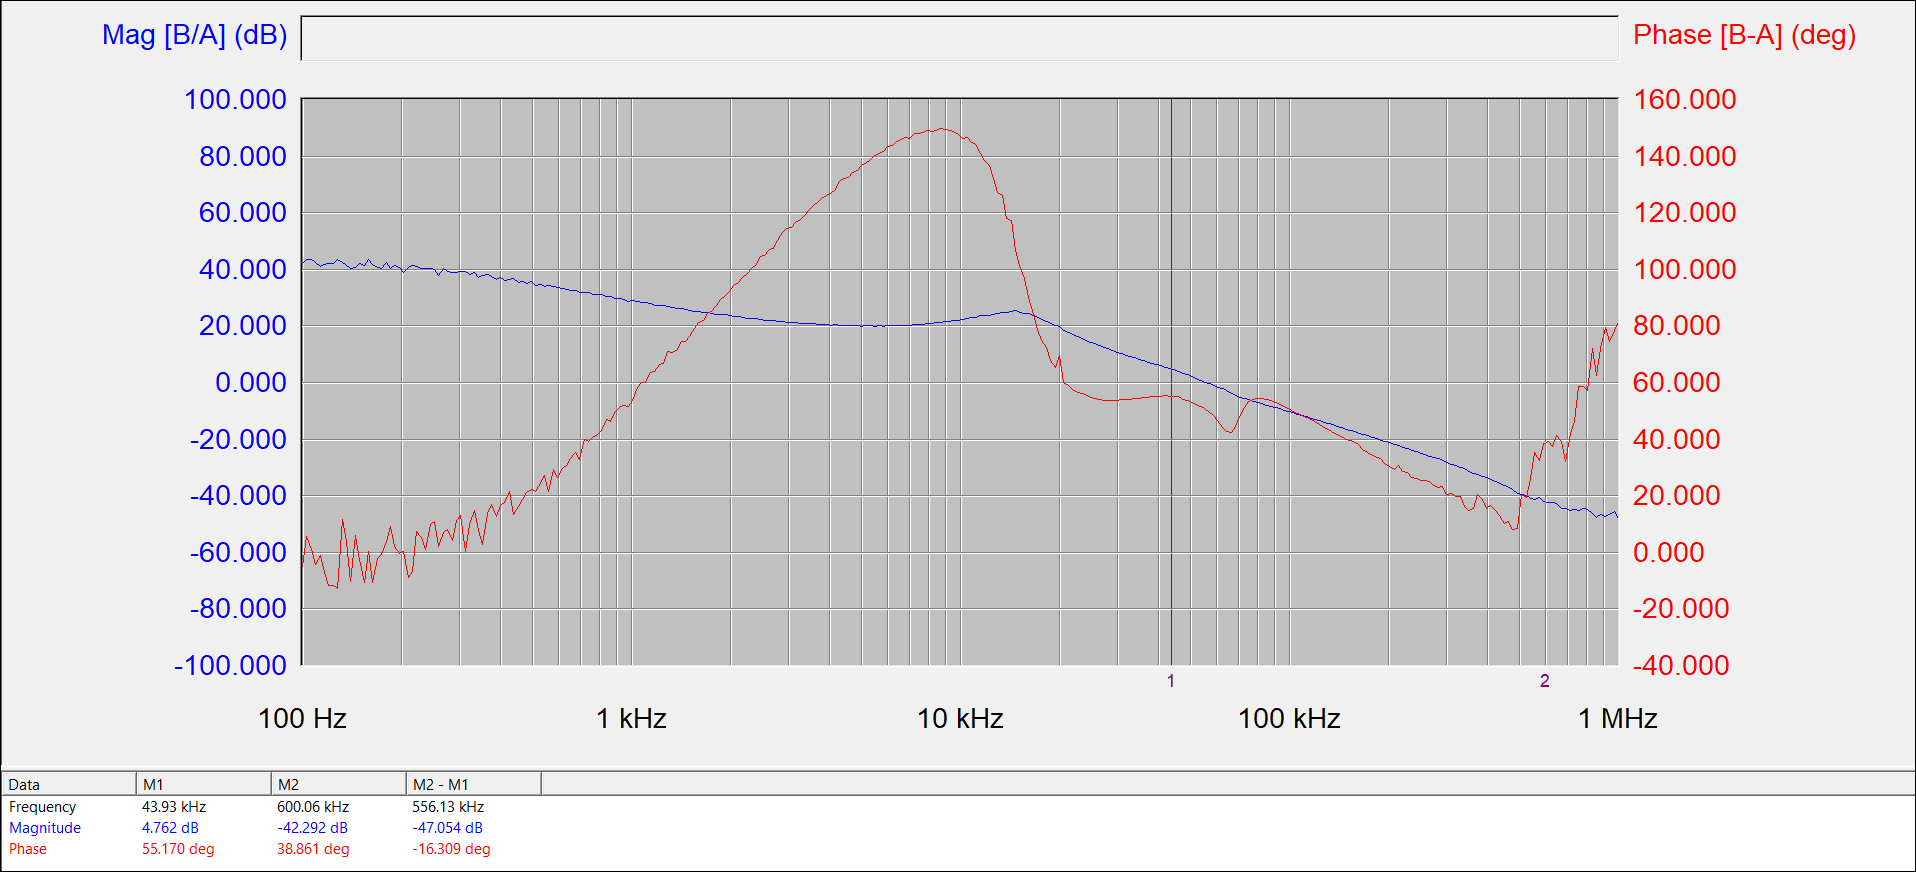
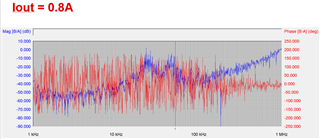
However if I draw 0.8A and more, the plot goes weird as below:
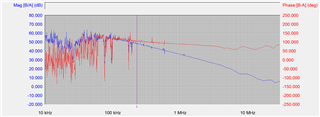
When I set a frequency band 10k to 30MHz to see what happens, it seems to be stable at very high frequency.
I you have any idea, please give me some advice.
Thanks,
Jay