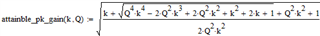
Hello, I am reading SLUP263 (LLC converter Design), (figure 12.a page 17), trying to draw the "Attainable peak-Qe" plot in MATLAB, to select proper Ln and Qe.
However, I do not know how to draw the Attainable peak gain plot! Can an expert help?

-
Ask a related question
What is a related question?A related question is a question created from another question. When the related question is created, it will be automatically linked to the original question.