This thread has been locked.

If you have a related question, please click the "Ask a related question" button in the top right corner. The newly created question will be automatically linked to this question.

TPS7A33: Output behaviour when in disabled state.

Part Number: TPS7A33

Hello. 

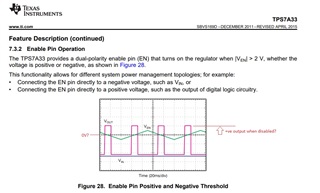
I'm trying to interpret Figure 28 of the datasheet which seems to show a positive output when the regulator is in the disabled state.  I am assuming that the central grid line is 0V.  Is this the effect of some external circuitry or am I missing something? 

Thanks.

  • Hello,

    Thank you for your question.

    I will get back to you within 2-3 business days.

    Best Regards,

    Hannah

  • Hello,

    Yes, the central line is 0V as Vin is a negative voltage. 

    The other photo does not show the voltage scale. I believe this graph will explain the EN pin more clearly.

    Best,

    Hannah

  • Hello.

    Thanks for the reply.  Why is Vout showing as a positive voltage when the regulator is disabled?

  • Without a voltage scale on this graph, it is quite difficult to tell if the voltage is even going positive. Disregard what I stated above, as the middle line may not even be 0V, because we do not have a time scale. 

    We are sorry for the confusion.

  • What we do know from the datasheet snippet is that Ven is swinging both +ve and -ve as the idea is to demonstrate that it is the magnitude, not the polarity, of the enable that matters.  This means that Vout really is going positive and is > 2 V as the datasheet talks about Ven going to at least 2V.  This assumes that all plots are using the same vertical scale.

  • Please see graph below:

    After looking into previous data, EN voltage ranges from -2V to 2V on the graph. When at -2V, Vout is expected to turn on immediately. Vout does not immediately turn on, because there is a delay from the capacitors. After the delay happens, the output then turns on.

  • Hello.  Remember that this is a -ve output regulator (Vin is -ve) so I think that the "on delay" that you have marked is actually some arbitrary time before the regulator switches OFF.  I've marked the on/off and off/on switching points below.  The Ven amplitude used in the example must be somewhat > 2 V.  In the absence of any Y axis scale I think that this diagram is too ambiguous to be of any value.  Still bugging me that the output of a -ve regulator is shown as going +ve when disabled but I'll just have to experiment to see what happens.

  • I would agree that this diagram is ambiguous, and not much data is available for this graph as well.