Hello,
Looks like efficiency graphs and load transient response graphs for PWM mode are missed in the datasheet. Any way to see it?
Thanks,
Eugene
This thread has been locked.
If you have a related question, please click the "Ask a related question" button in the top right corner. The newly created question will be automatically linked to this question.
Hello,
Looks like efficiency graphs and load transient response graphs for PWM mode are missed in the datasheet. Any way to see it?
Thanks,
Eugene
Hi Eugene,
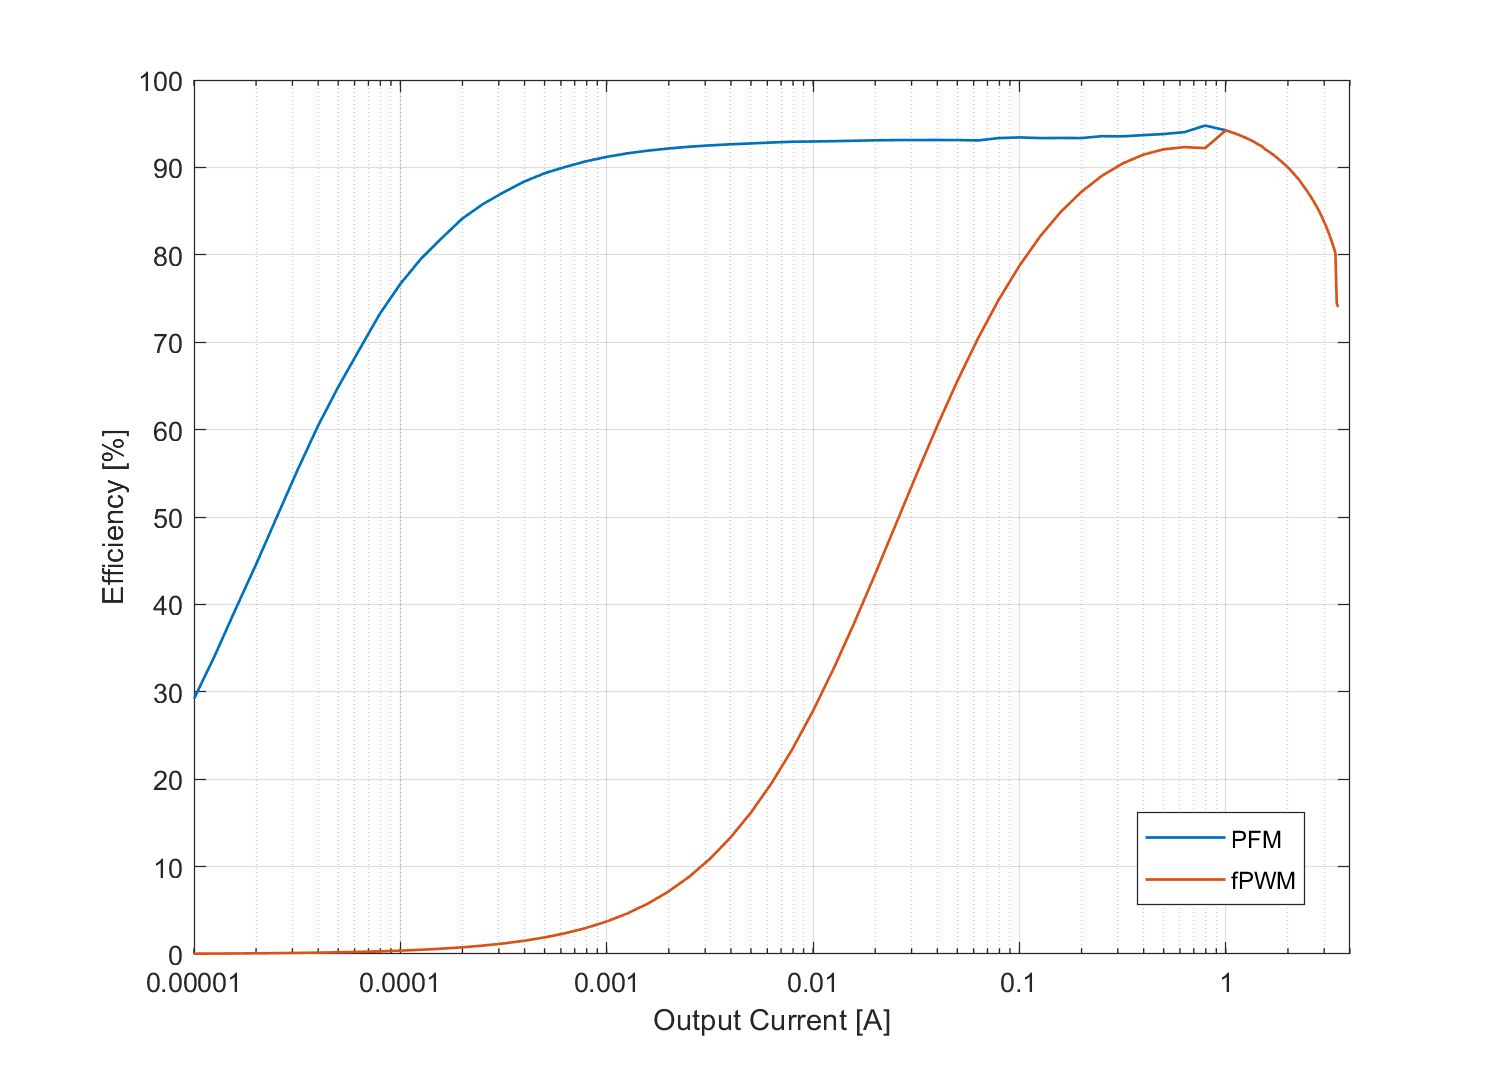
This is a typical efficiency under your Vin/Vout conditions:
Vin = 3.5 V, Vout = 4.1 V
As for the load transient measurements, we do not have it for your exact conditions. The closest we have is for Vout = 5.2 V and Iout = 0 A to 2 A:
For your case, you can expect about half the value than for the above conditions, therefore, undershoot about ΔVout- = 200 mV, and overshoot around ΔVout+ = 150 mV.
Best regards,
Milos