This thread has been locked.

If you have a related question, please click the "Ask a related question" button in the top right corner. The newly created question will be automatically linked to this question.

AP300 frequency response analyzer erratic bode plot

Other Parts Discussed in Thread: TL431, UCC28911, LM25037

Hello,

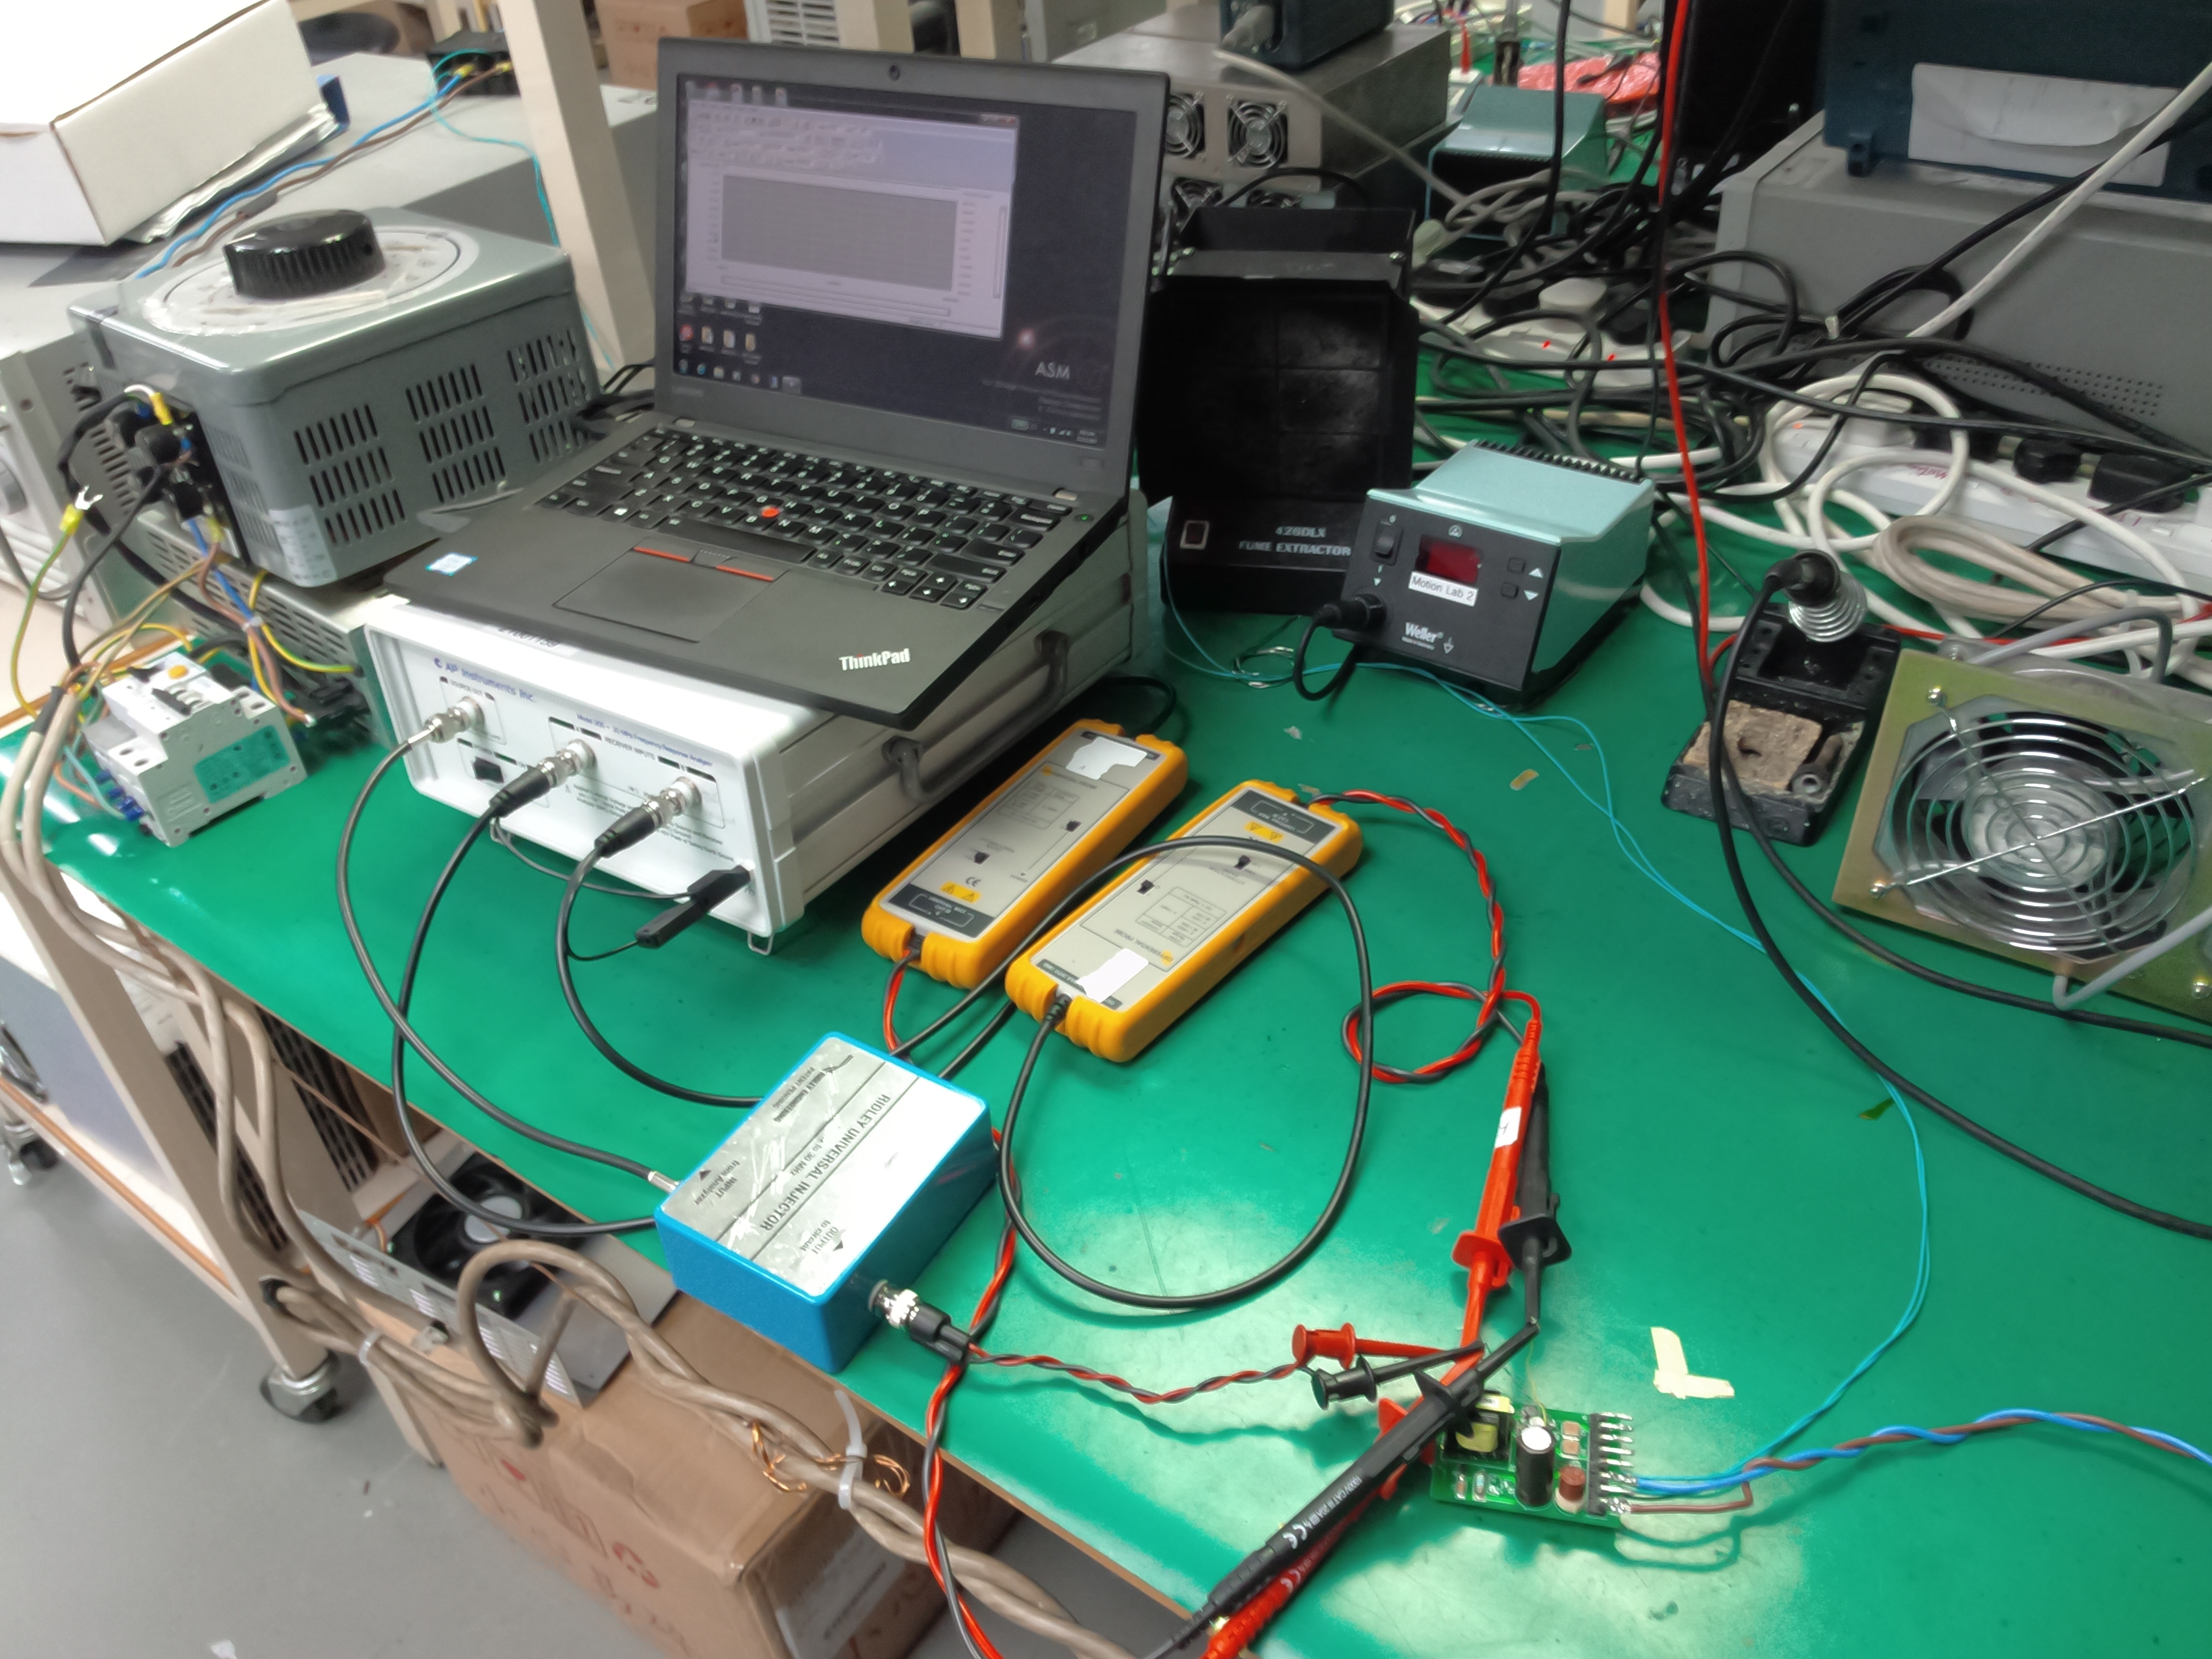
I am trying to find measure the Bode Plot of a 12W Flyback converter made from Viper27 IC. It has an integrated MOSFET and controller.

I want to know the phase margin at the crossover frequency to establish its stability and Steady state error.

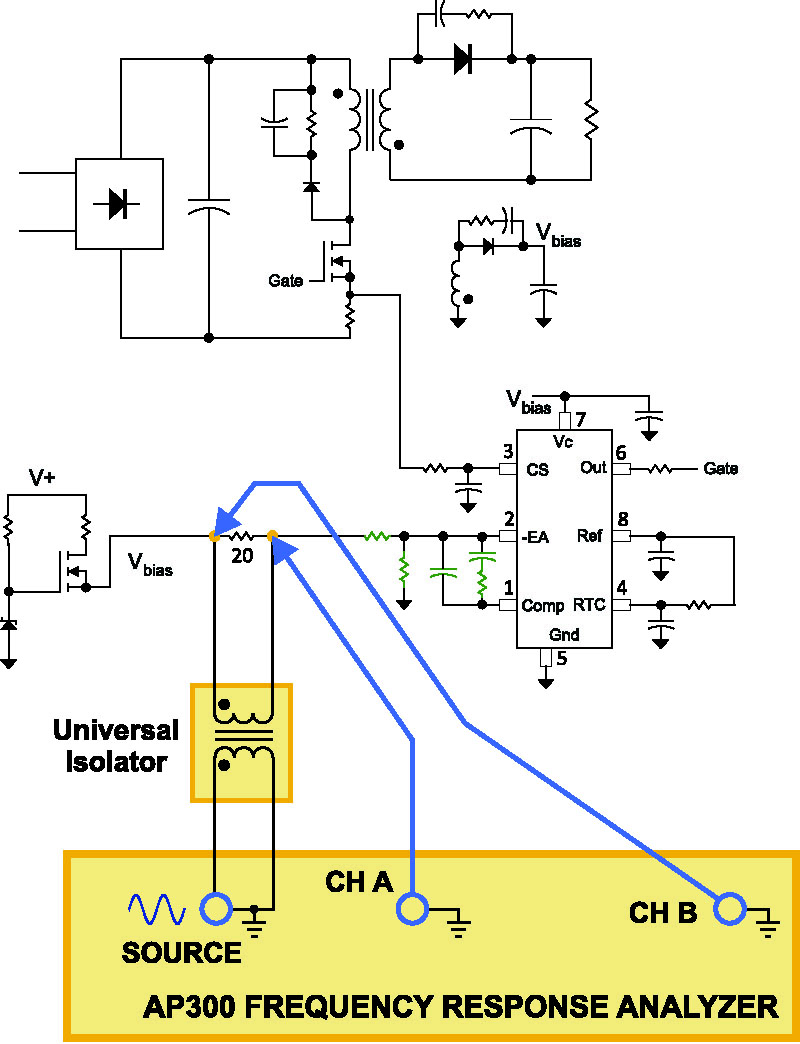
The feedback is controlled by TL341. It has a feedforward cap across high-side feedback voltage divider resistor and a C parallel with a series RC network across ref and cathode pins of the TL431.

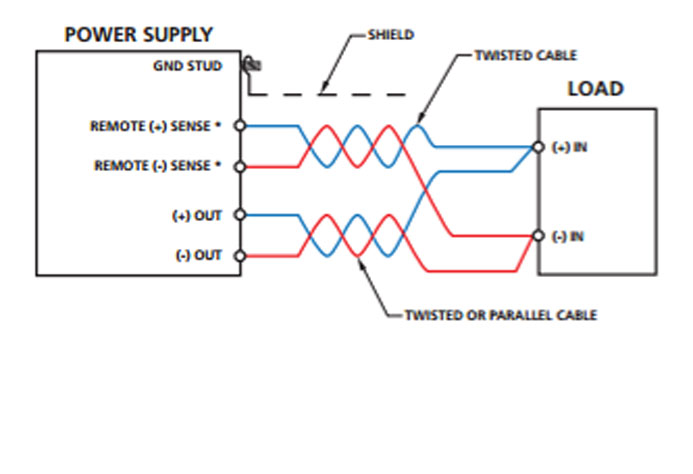
I am using the AP300 frequency response analyzer. I inserted a 22 ohms resistor above the high-side feedback voltage divider resistor. I am injecting the noise signal using their high bandwidth transformer. 30MHz.

At no load and full load the output is stable from measuring the flyback output voltage.

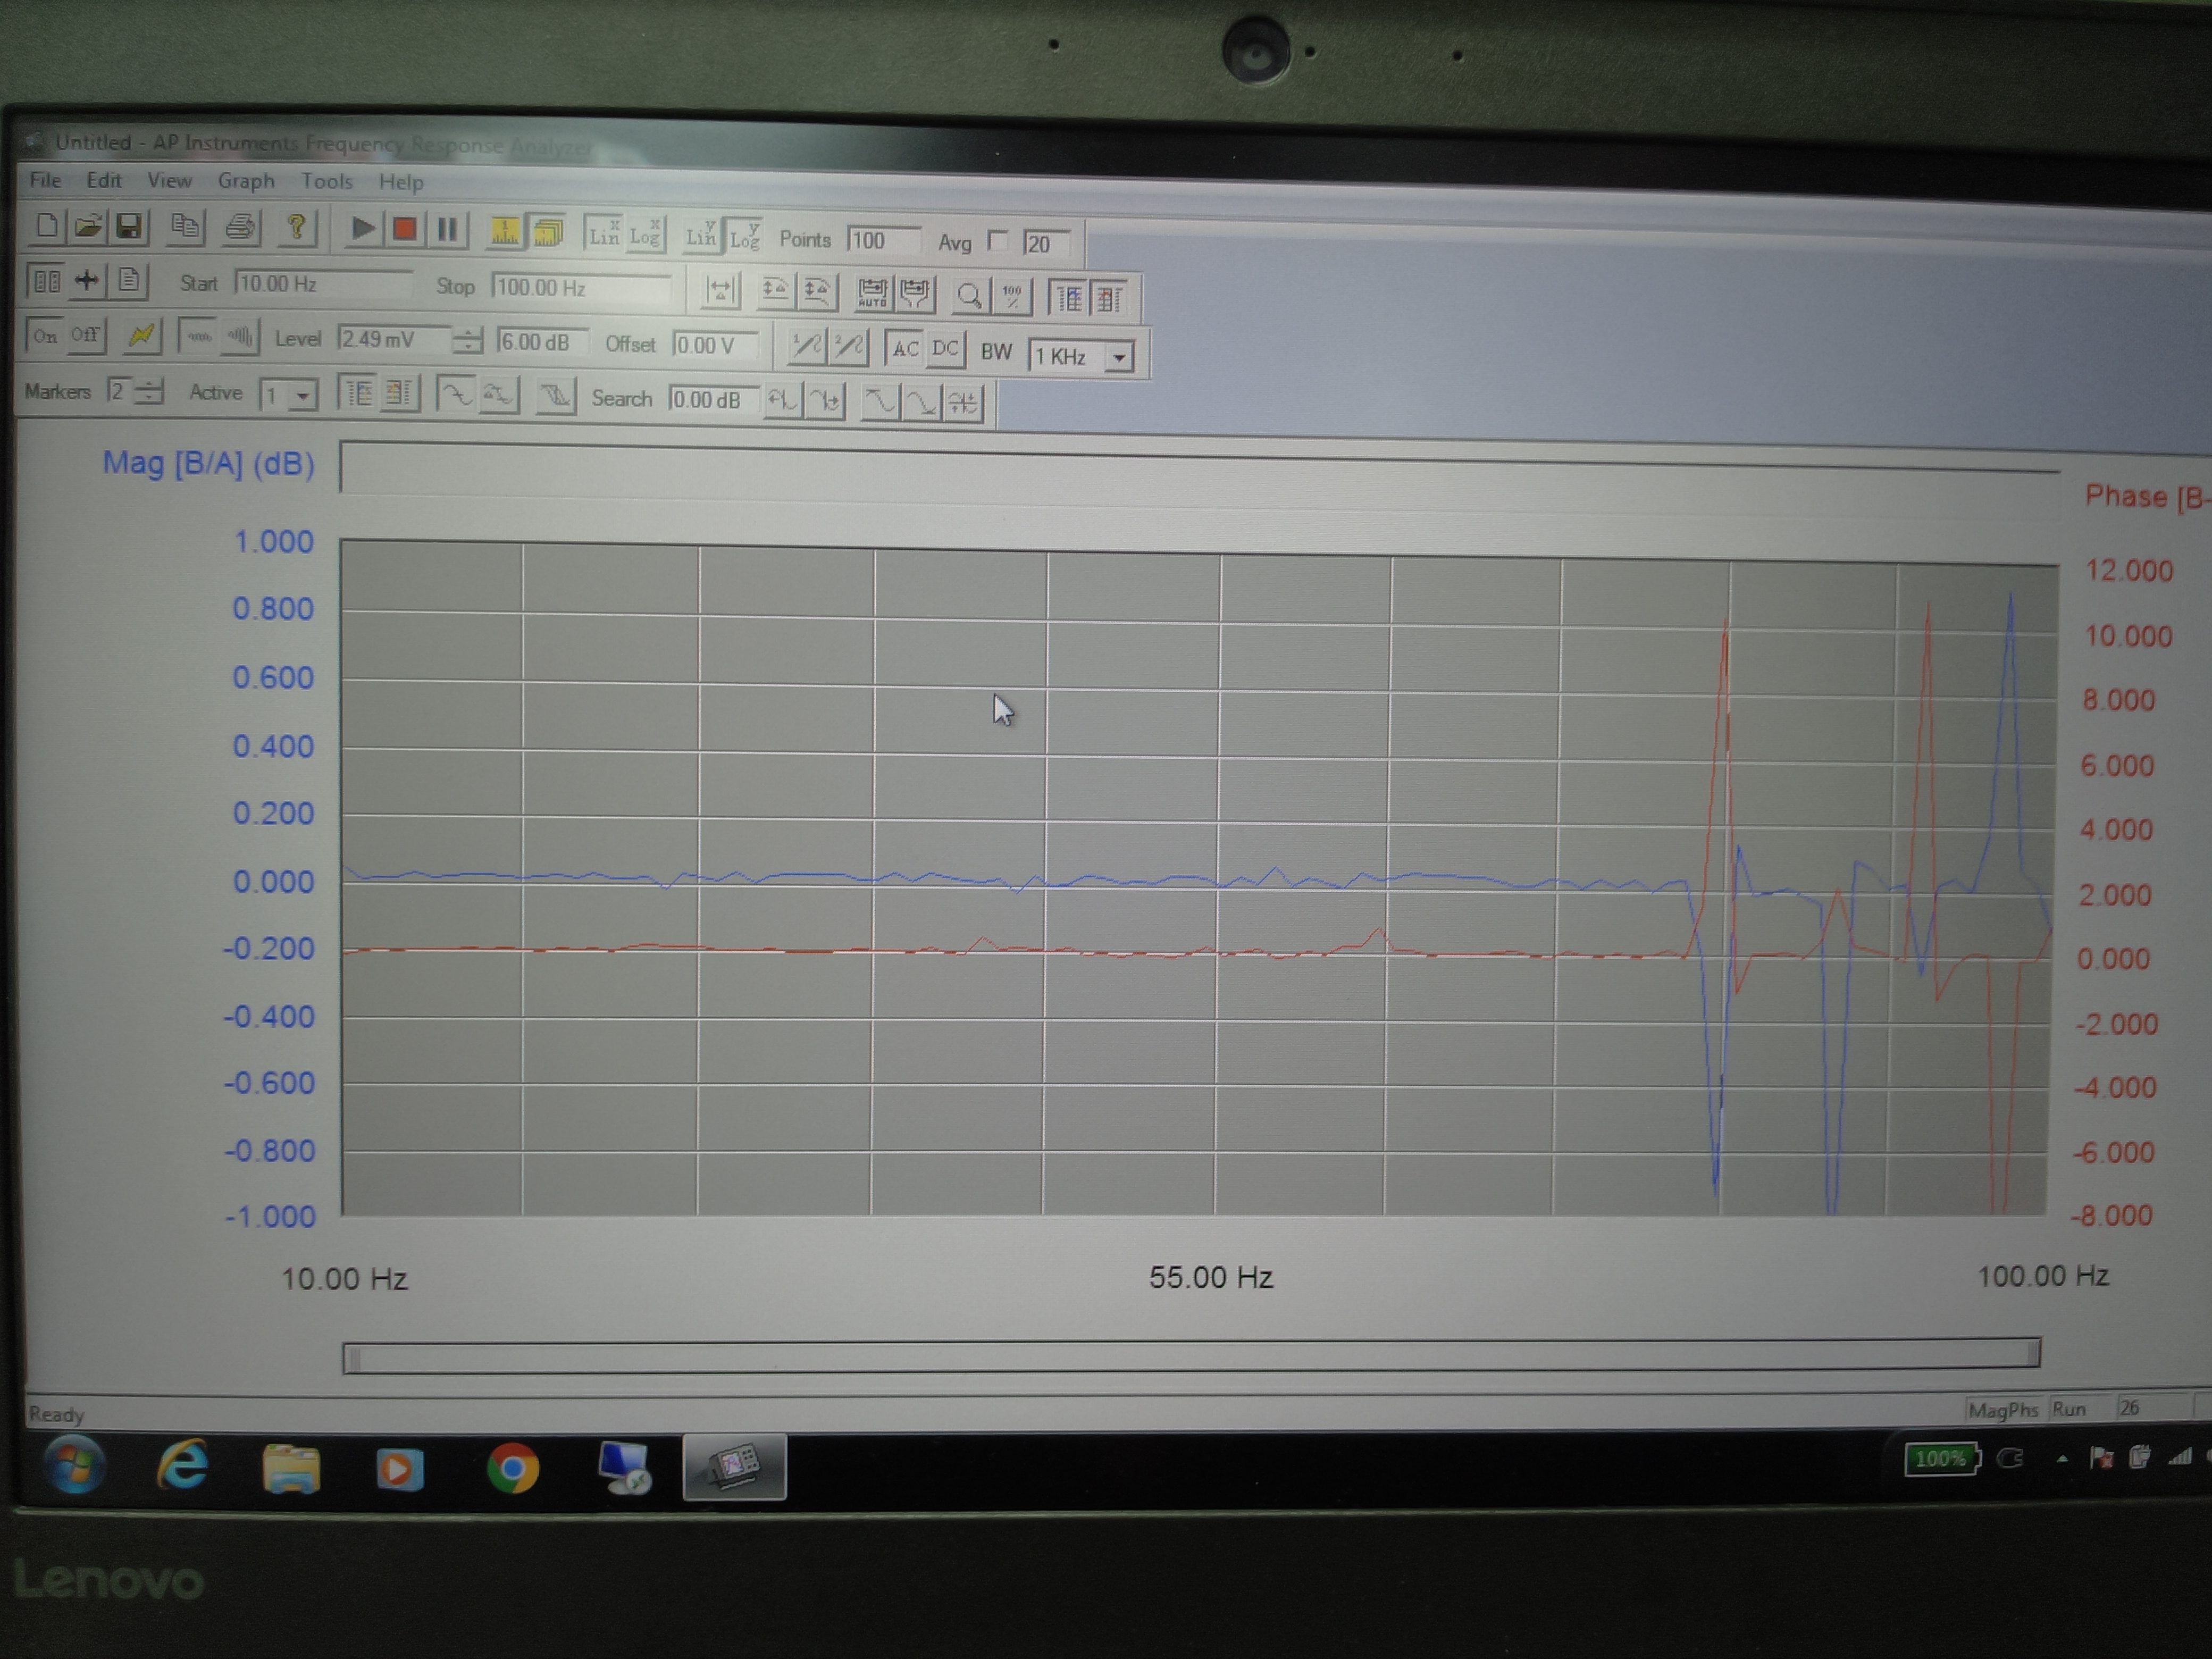
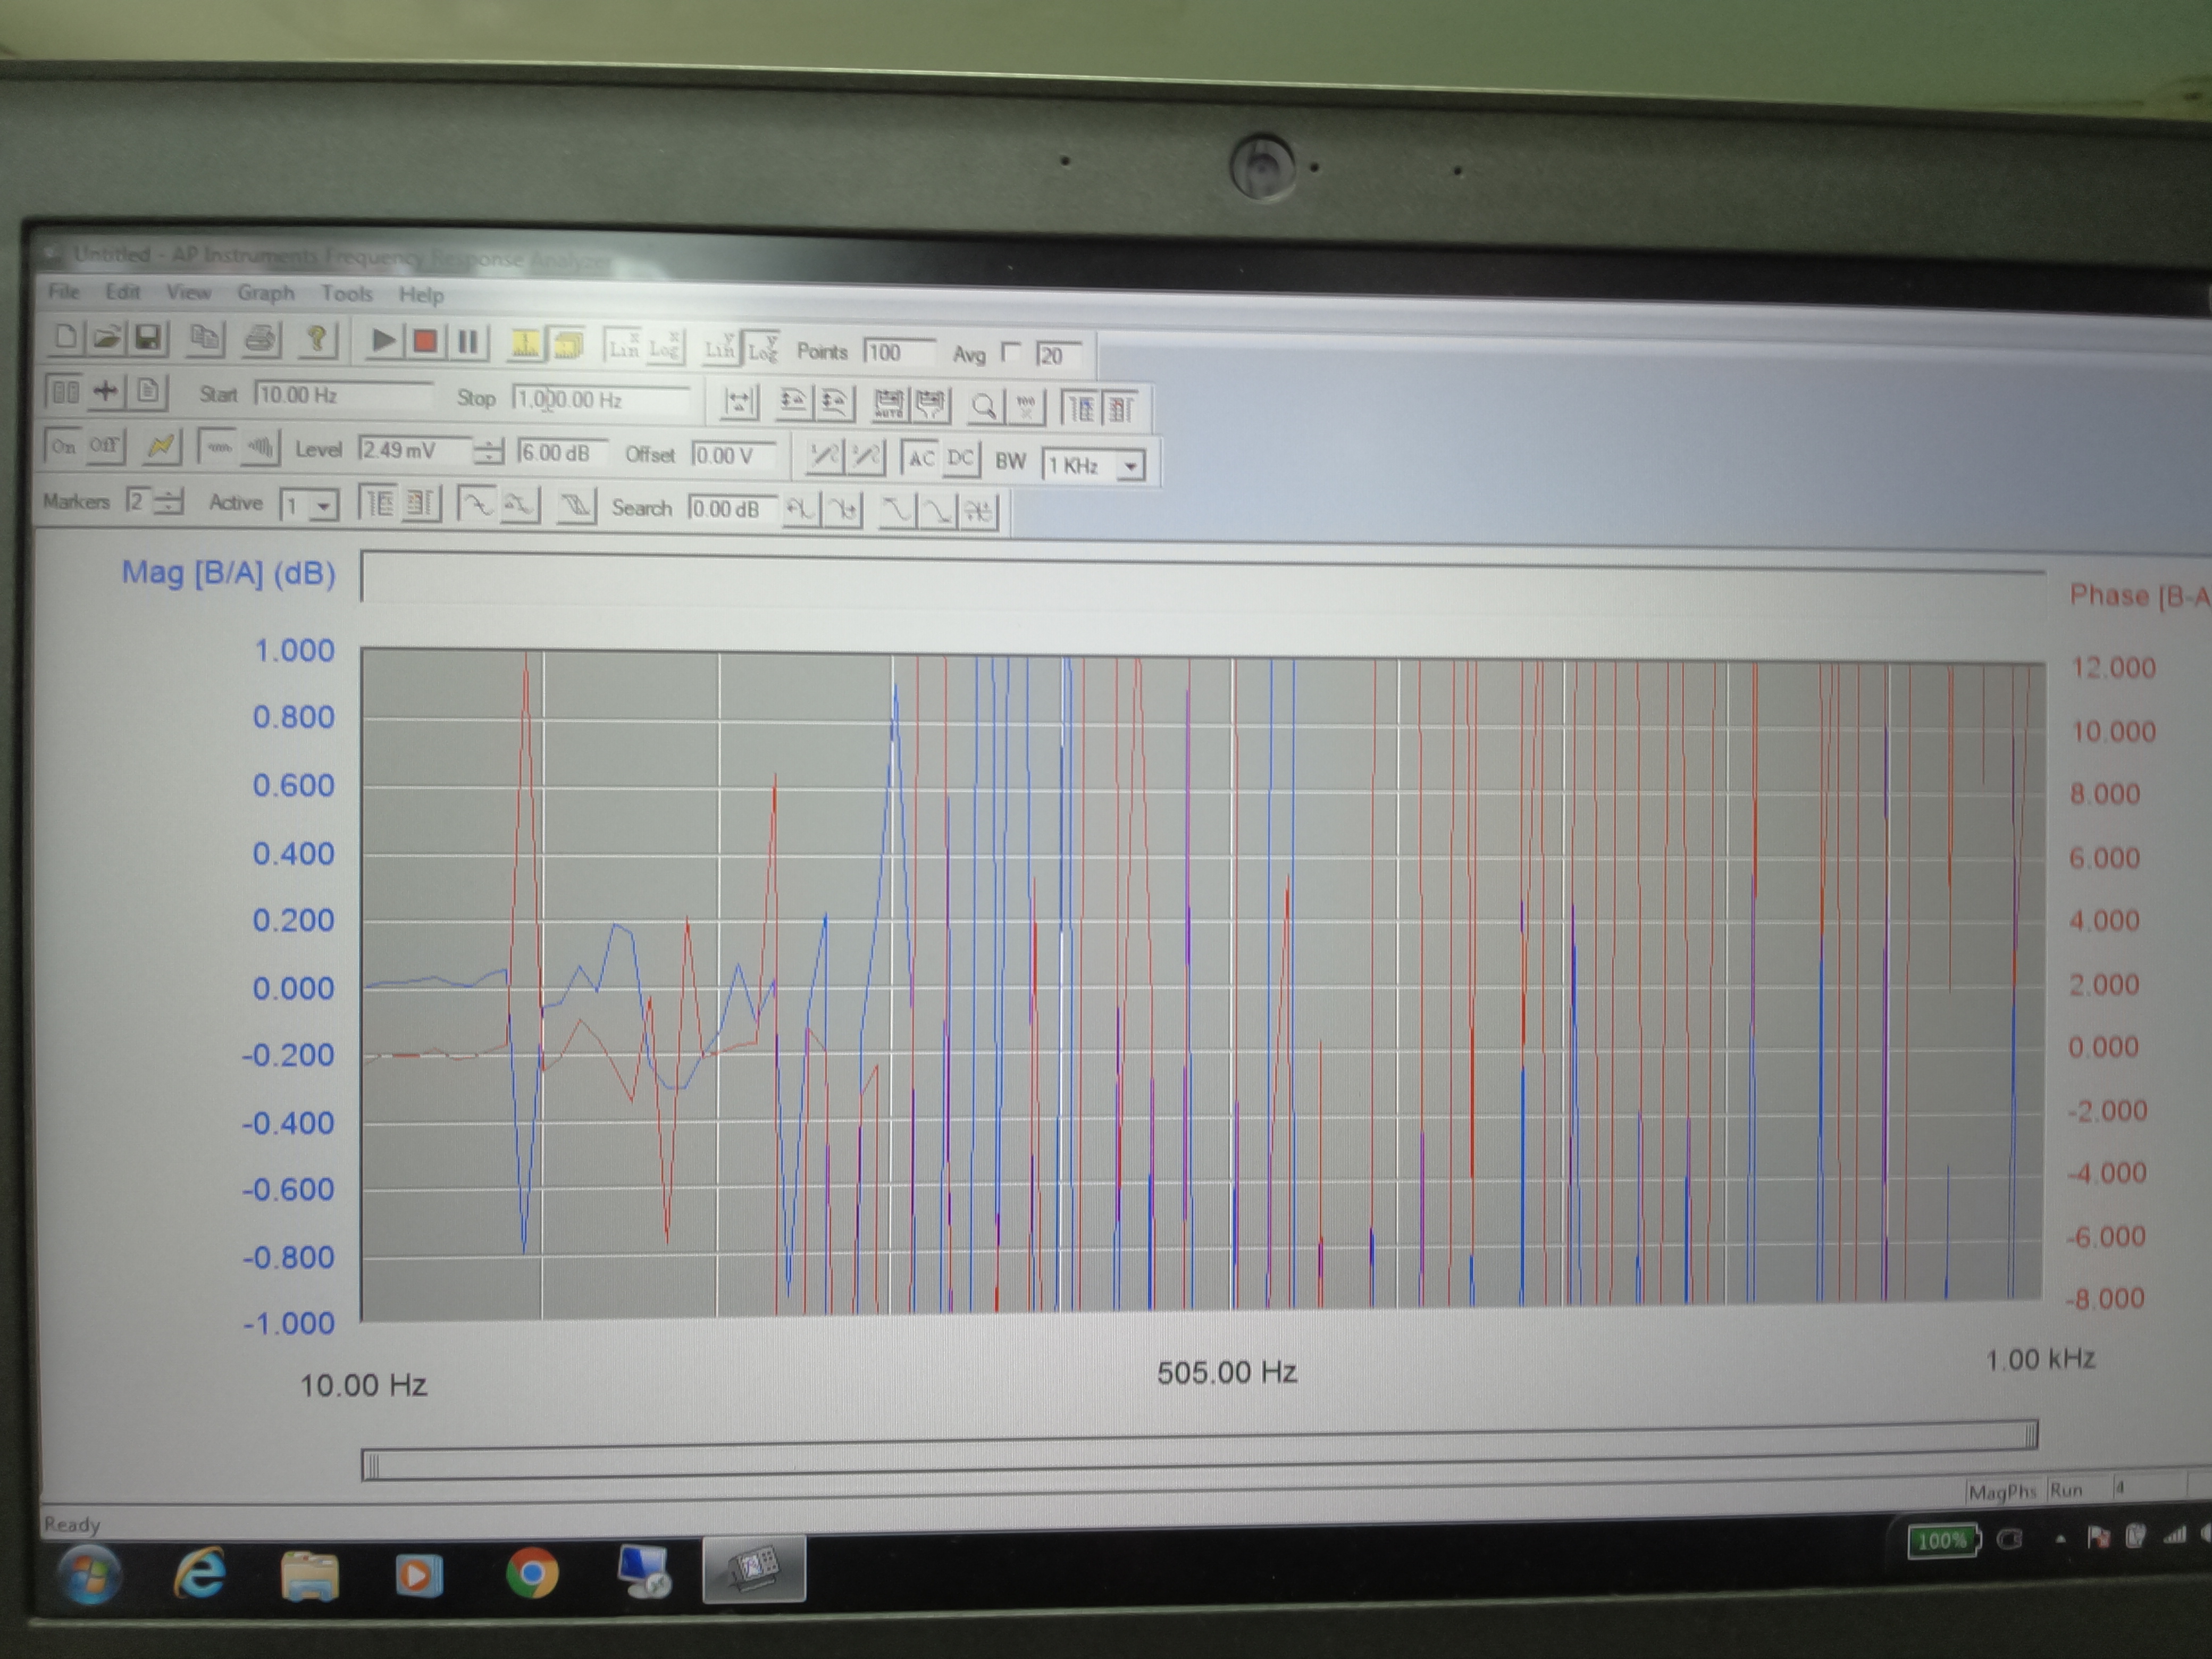
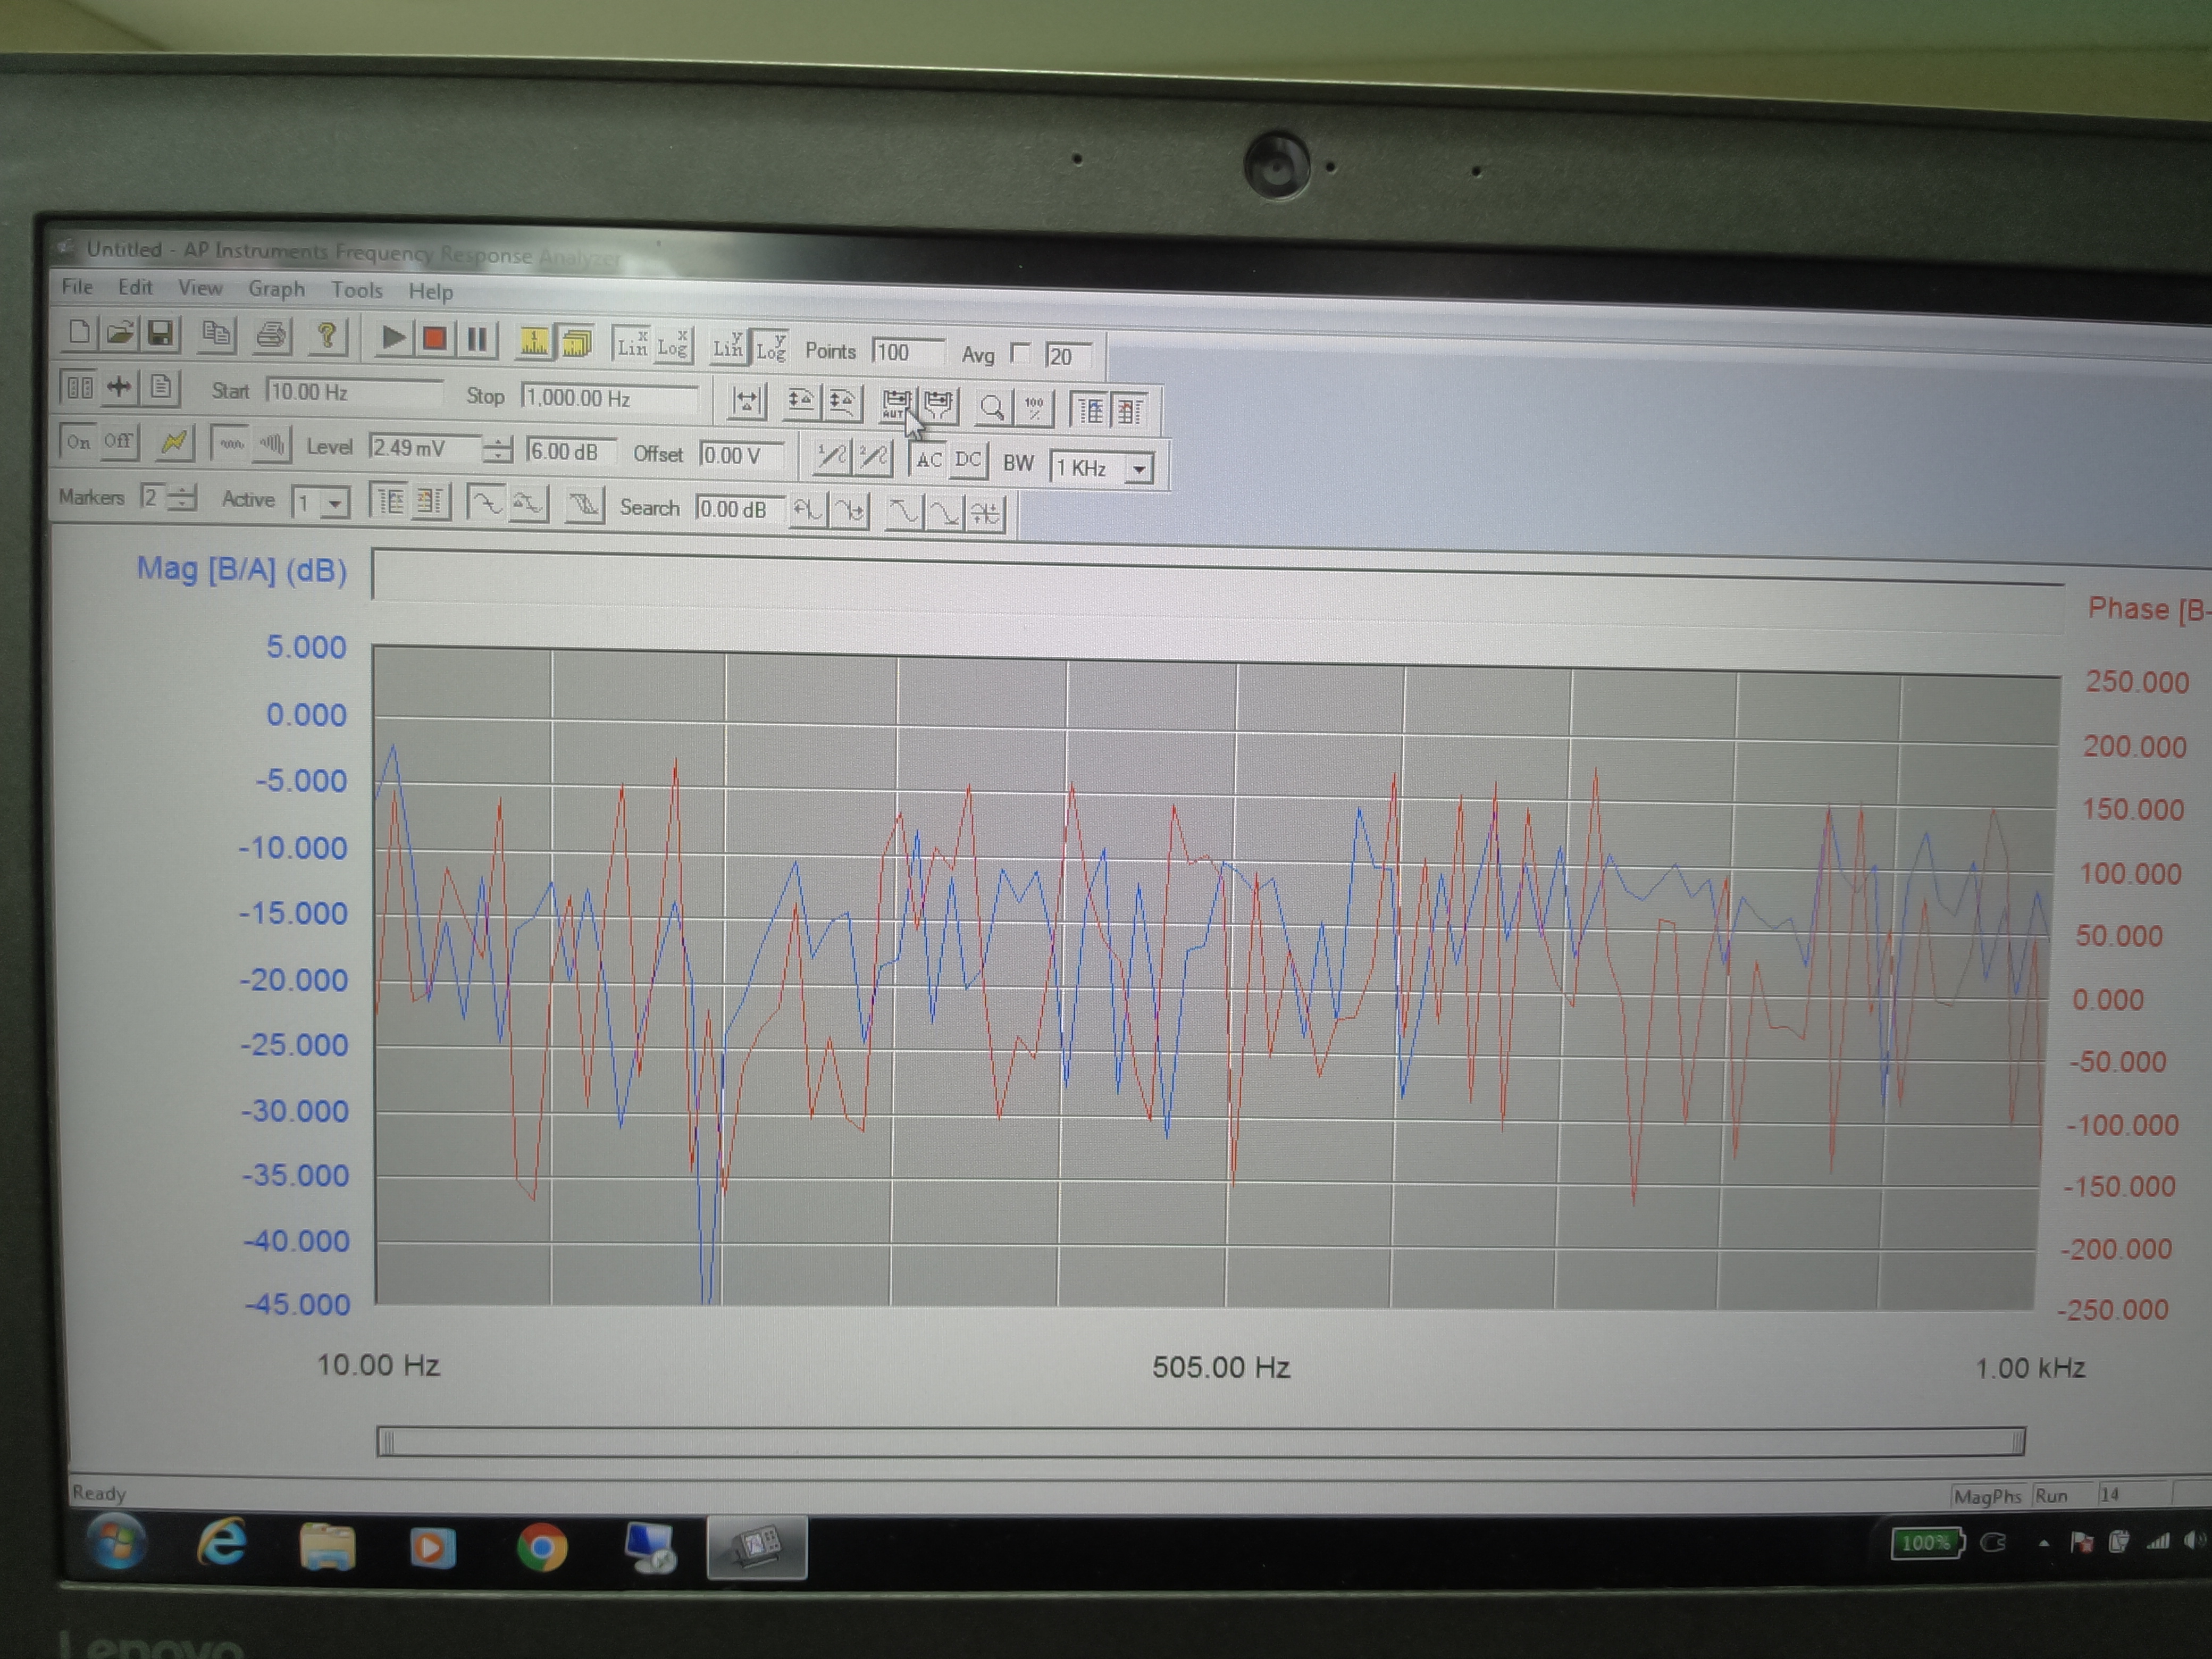
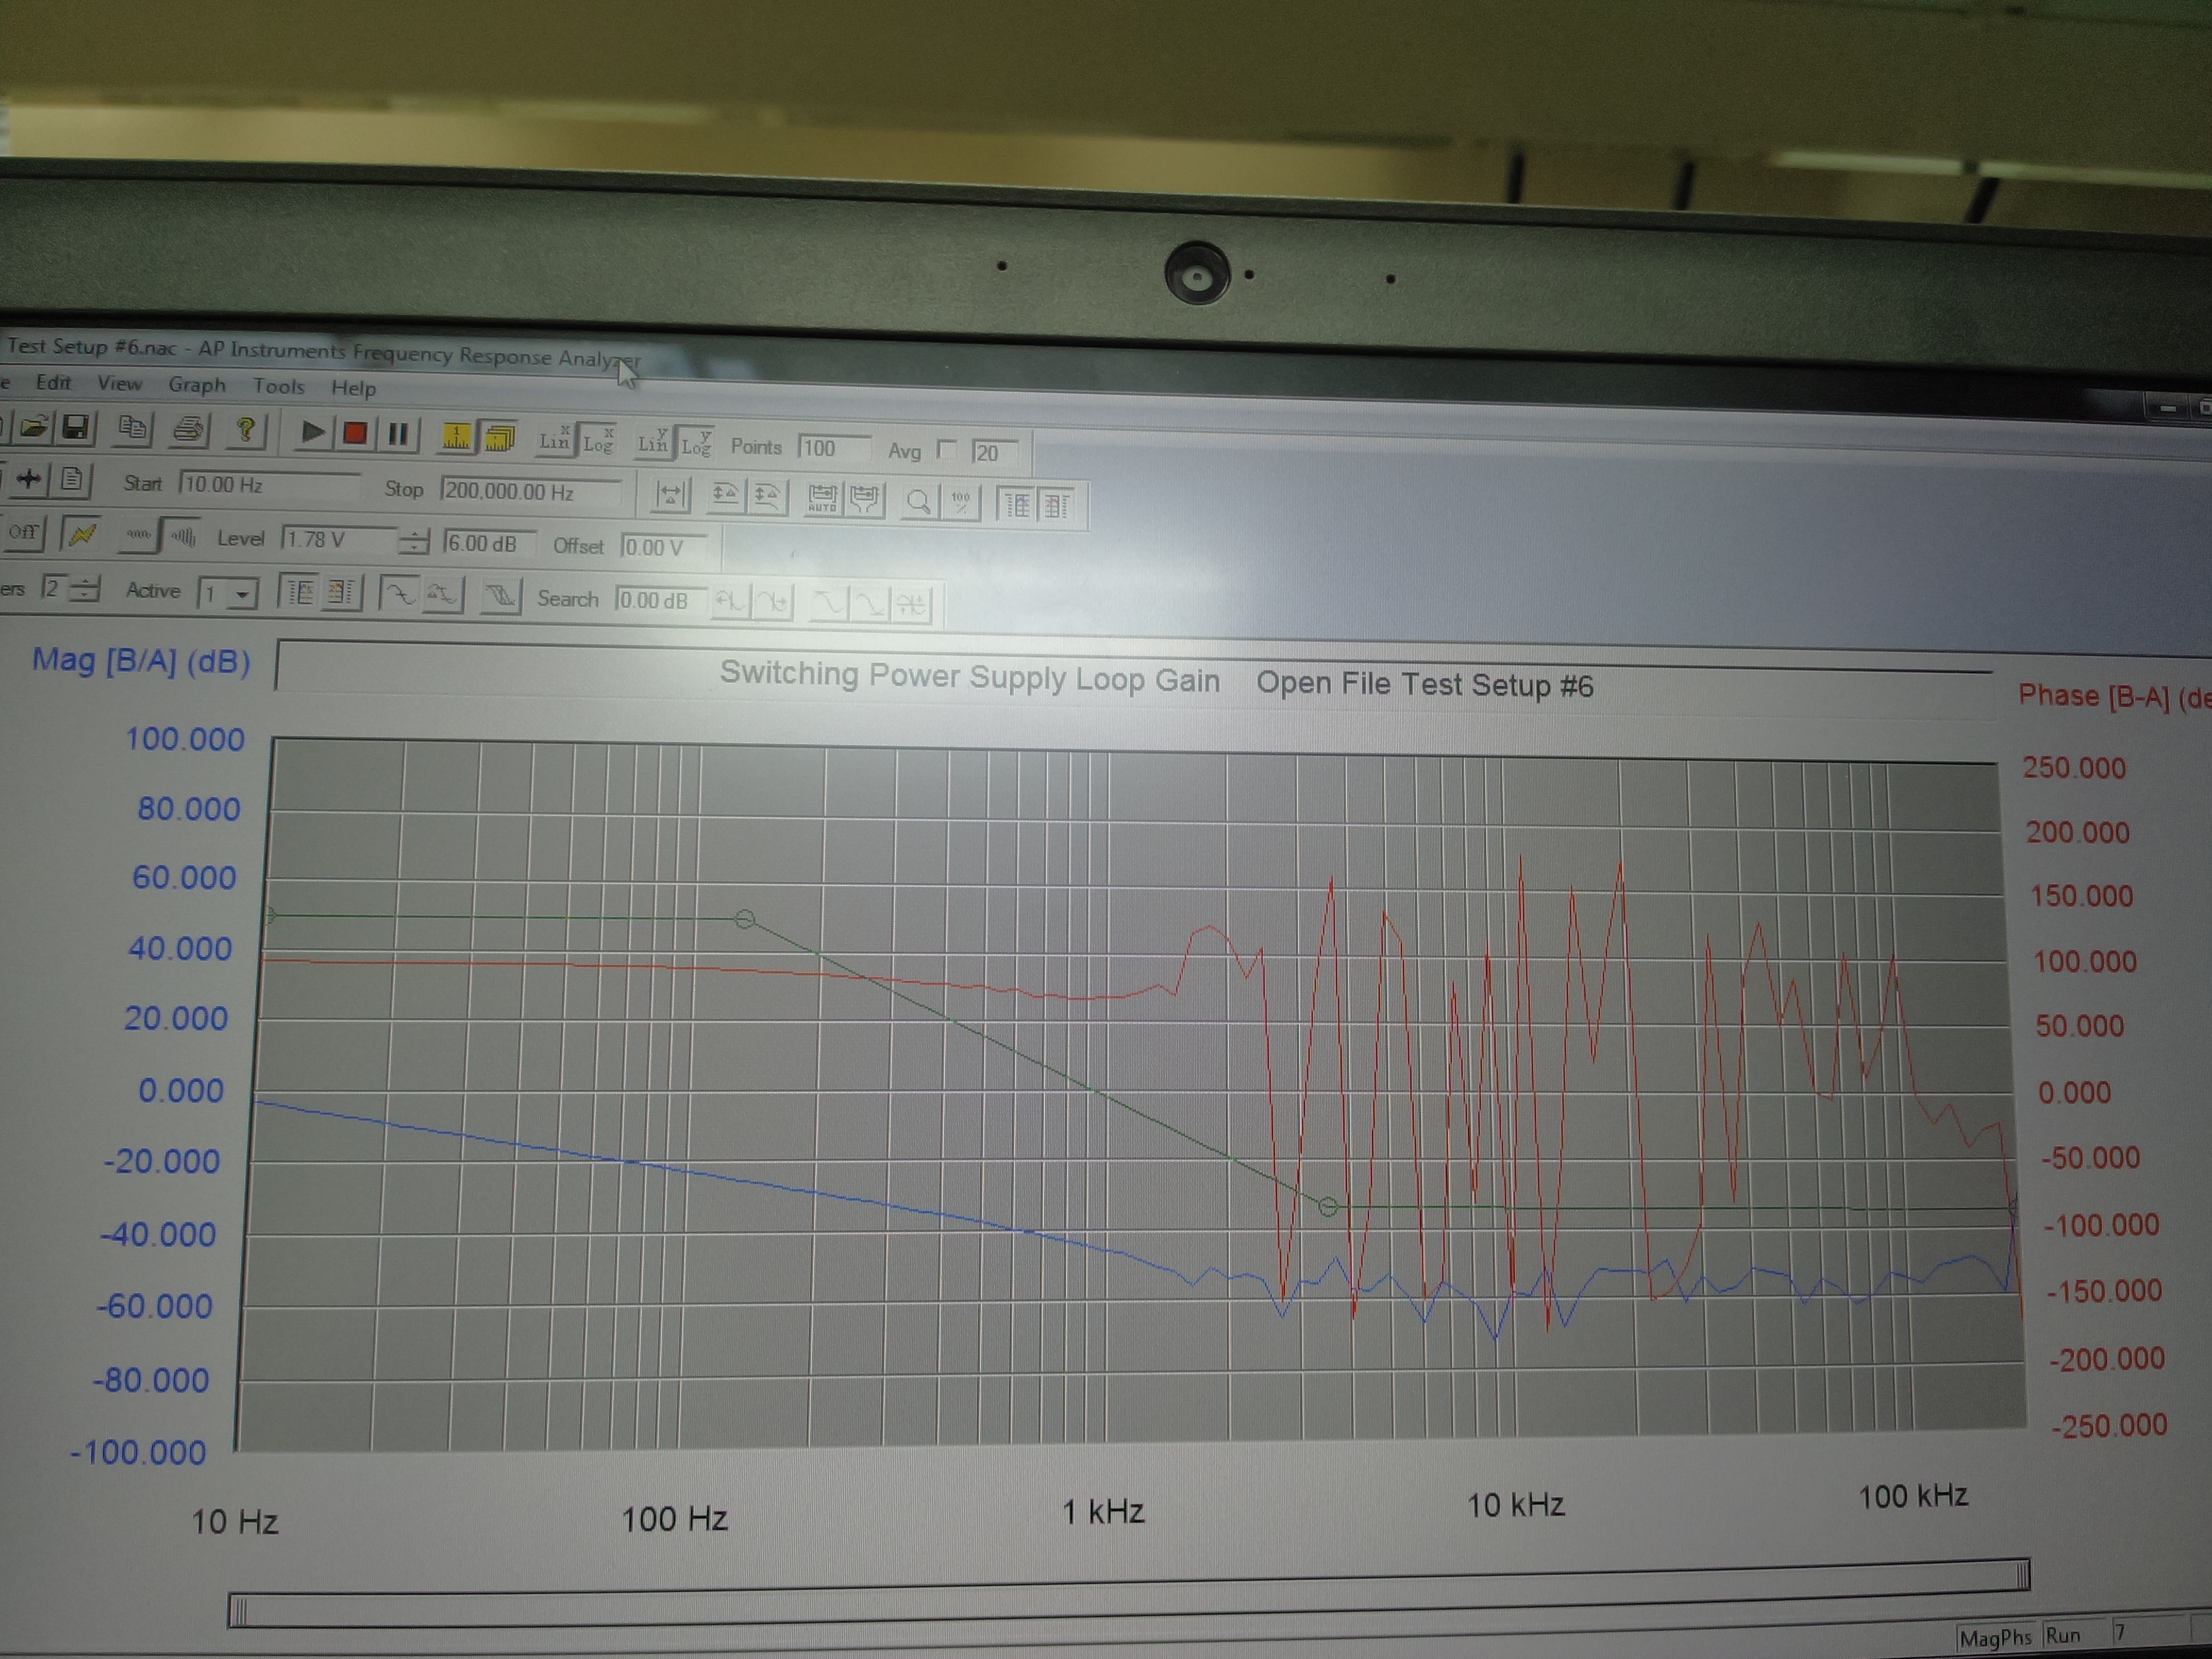
The problem is everytime I try to measure it on the analyzer the phase and magnitude plots look erratic. They have sharp edges and they cross the 0dB and 180 degrees line many many times.

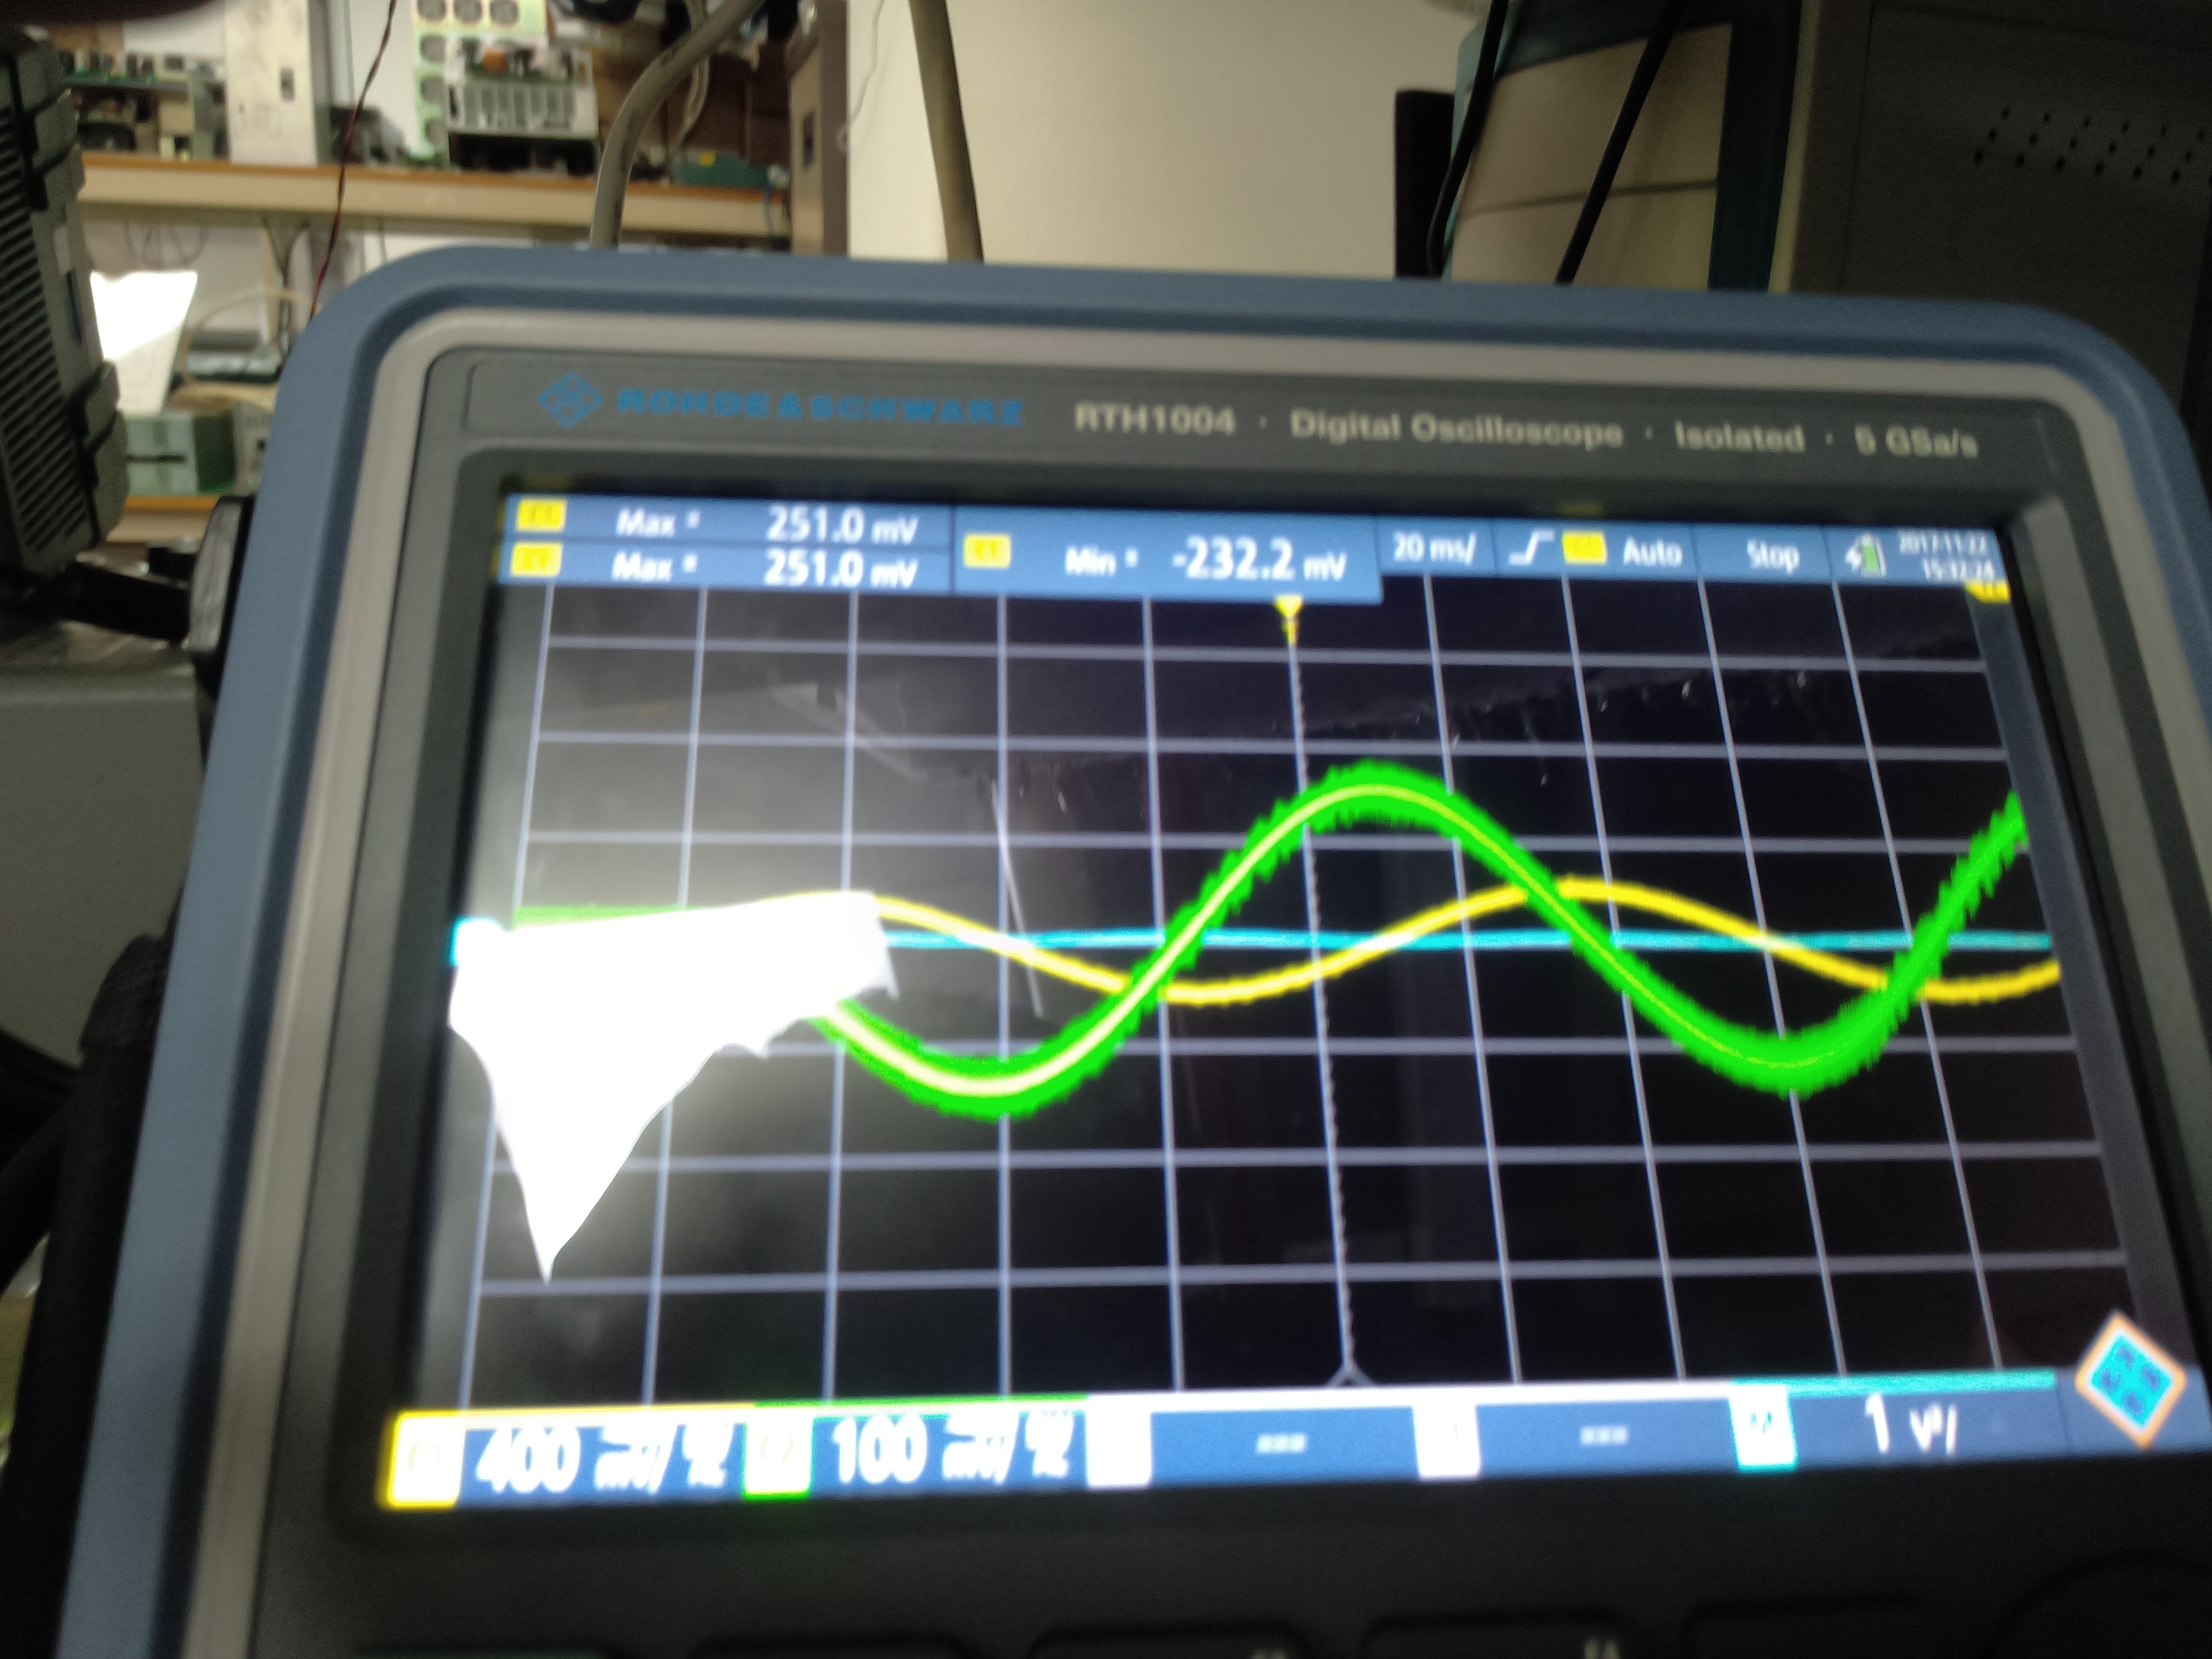
I have attached the waveform and test setup (similar) for your reference.

Image result for ap300 analyzer

Please help me to identify how I can get a clean bode plot?

  • Hey Jose,

    Although I'm not able to support you in much detail since you're not using a non-TI device, I would suggest using the UCC28911. This device integrates the high voltage power MOSFET and requires fewer external components and features internal loop compensation.

    Let me know if this helps.

    Regards,
    Davit
  • Hey Davit,

                         Thanks for your reply, Actually we are testing the AP300 Analyzer with low power SMPS first. We are using TI devices like LM25037 LM25037/-Q1 Dual-Mode PWM Controller With Alternating Outputs in our 1200W push-pull converter. Ultimately, we want to check frequency response of all our converters so we will be testing TI products with the AP300 analyzer.

    The first photograph is gain and phase plot up to 100 Hz when output is 15V and there is no load.

    The second photograph is gain and phase plot up to 1 KHz when output is 15V and there is no load.

    The Third photograph is gain and phase plot up to 1 KHz when converter is OFF. Actually, the correct waveform should be a flat one with 0 phase and 0 gain right?

    The fourth and fifth photos show my test setup. Do you think it can be due to noise or wires overlapping? How can I make the gain and phase plot clean when converter is turned OFF?

    -Peeterson.

  • Peeterson,

    For isolated designs we usually add a 49.9 ohm resistor from the output to the resistor divider in the TL431 path as seen in this design as R77:

    TI typically uses Venable frequency response analyzers where we setup the connections on either side of R77 and then ground (3 connection) and then have it sweep from a few Hz to 10MHz or similar. The converter needs to be running and regulating while you run it. you should run with load and without load at high and low line to check stability. Aside from that the frequency response analyzer should have instructions on how to calibrate it and set it up for consistency.

    Alternatively you could review the stability margins by observing the load transient for example as seen here:

    Regards,

    John

  • Hi John,

                           "For isolated designs we usually add a 49.9 ohm resistor from the output to the resistor divider in the TL431 path as seen in this design as R77: "

                             Yes I have also put the resistor at that location except it is 22 ohms because the AP300 guide is using 20 ohms resistor.

    " The converter needs to be running and regulating while you run it."

     To simplify things we have first used a 5V power supply with output voltage sense capability as shown below.


    We broke the loop at Remote (+) Sense and inserted the 22 ohms resistor. The power supply was loaded to 2A at high/low line. 

    "Aside from that the frequency response analyzer should have instructions on how to calibrate it and set it up for consistency"

    We are using differential voltage probes connected from either side of 22 ohms resistor to (-) OUT. The attenuation ratio is 1/20. I am wondering how to set this in the AP300 software. There is a button called probe calibration but it requires a user defined file to be uploaded. I do not know how to do this. Currently this is not done. I tested a passive LC network, the gain and phase response were as per calculation.

    Now the problem for the 5V power supply is that I cannot see the gain go above 0dB at low frequencies. As per the TI document in the link below power supply gain should be positive for frequencies up to the crossover frequency of few KHz and then it should go negative. 

    www.ti.com/.../snva364a.pdf

    However, the waveforms I have got are not similiar. They are shown below :

    I have hooked up a oscilloscope to see if the output sine wave amplitude (green) is becoming greater than the incoming Sine wave amplitude (yellow) for low frequencies. 20log (out/In) should be positive for low frequencies but the AP300 analyzer does not show that. I have checked to see if the output and input are interchanged wrongly. No. They are connected correctly. Do you think probe calibration is still the problem or is there anything wrong in my setup? The time domain signals are shown below. 

    Please think about it. Thanks.

  • This issue is still not resolved. Please support.

  • Jose,

    You are correct that you should see positive gain at DC and low frequency, then the gain crosses zero dB at some higher frequency, and then it goes negative and stays negative for higher frequencies. The plot should indeed look in this way.

    We at TI typically use a Venable frequency response analyzer and I don't remember hooking either side of the injection resistor (your 20 ohms resistor) into an oscilloscope. The frequency response analyzer would connect to either side of this resistor single-ended with one connection to ground for the analyzer as well.

    You may need to confer with the MFR of the analyzer at this point from what you're describing though. 

    Apologies that we can't help more than this.

    Regards,

    John