


Dear expert,
We measure bode plot for close loop stability for TPS562219A.
But there is a drop around 20KHz, May I learn from you how to improve this drop?
Schematic and bode plot are in attachments.(note: R315 have been change to 20-ohm)

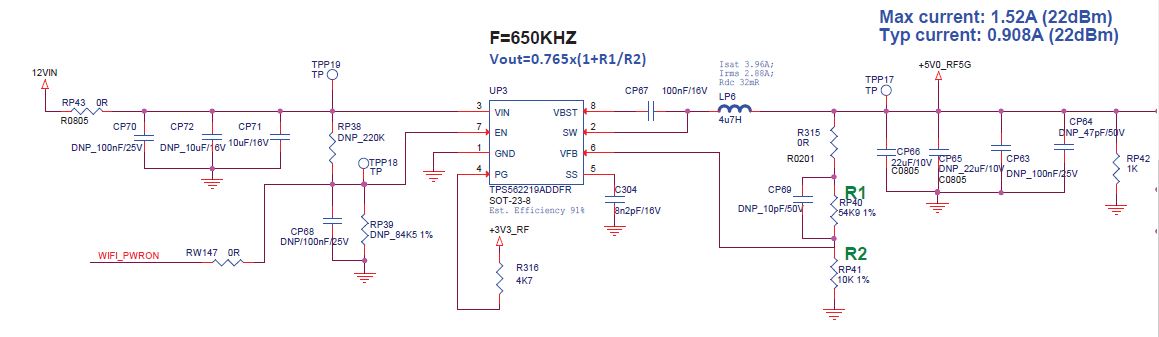
Dear expert,
We measure bode plot for close loop stability for TPS562219A.
But there is a drop around 20KHz, May I learn from you how to improve this drop?
Schematic and bode plot are in attachments.(note: R315 have been change to 20-ohm)
