This thread has been locked.

If you have a related question, please click the "Ask a related question" button in the top right corner. The newly created question will be automatically linked to this question.

BQ34Z100-G1: True FCC becomes smaller

Part Number: BQ34Z100-G1
Other Parts Discussed in Thread: GPCCHEM, BQ34Z100, GAUGEPARCAL,

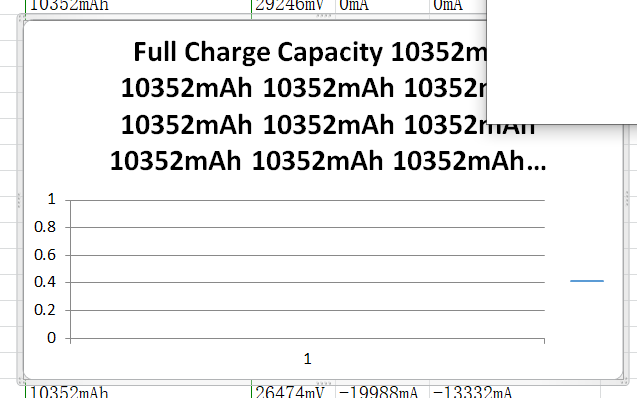
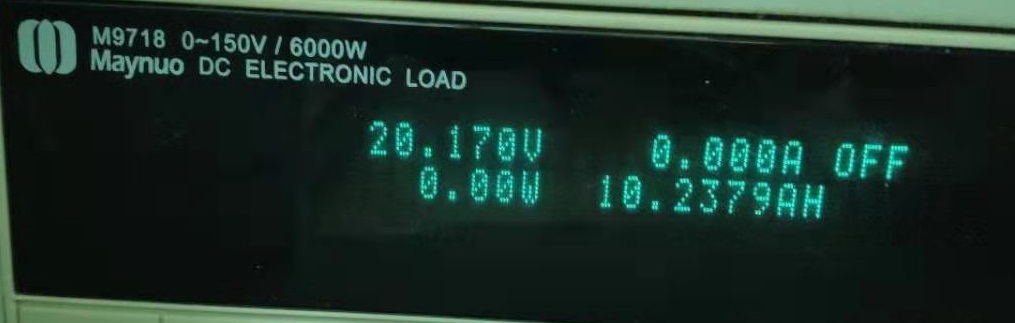
Hello, I found that True FCC becomes smaller,Attach the log(20A load discharge), please see what is wrong.

No. 3 20A discharge.xls

  • Hi,

    The log I am unable to graph anything in excel.. Can you fix this?

    Thanks,

  • Hi Nick,

    If you enable editing you should be able to graph the log file in excel.

    I was able to and I see what this user is talking about.
    On discharge the True FCC updates to a value lower than the design capacity and FCC.

    Hi user6362354,

    This is pretty much the same issue I've been seeing in which the True FCC updates to a value well below the rated capacity of the pack.

    I'm still working with TI to remedy this issue with my application.  It may be CHEM ID and Learning Cycle related depending on your pack setup.

    Regards,

    Kevin

  • In my version of excel this all I see:

  • Hi User,

    I have opened a lot of customer logs, never had this problem.

    We also need the .gg and details on the battery.

    Thanks,

  • Hello, some battery specifications are as follows:

    Sanyo NCR18650GA 7S3P 10350mAh
    Cell Capacity (Typical): 3450mAh
    Cell Nominal Voltage: 3.6V
    Cell Full Voltage: 4.2V
    Cell Discharging End Voltage:2.5V

    Some files are packed(Current scaling 4x):

    3.zip

    I don’t know if the information I provided is sufficient.

  • Hi,

    We recommend using the FCC (which is filtered), trueFCC is the raw output from impedance track and can jump like that.

    Best regards,

  • Hi Nick,

    Is there anything that would help the True RC match the FCC after an update or relax period?

    In my case, when I charge the pack, the True RC reports the real world pack capacity.

    But after relaxation, the FCC doesn't end up converging with the True RC.  It reports much lower.
    So when we go to charge the pack, we get to 100% too fast because FCC should be in-line with True RC, but it is not.  We count up past FCC and True FCC.

    This happens even after successful learning cycles.

    Is there anything that can be done to remedy this? 

    A setting in the Data Memory? Would turning off Smoothing help?

    I can't see why the Impedance Tracking would limit the FCC to a value that is much lower than the Design Capacity.

    Any insight would be helpful.

    Thanks,

    Kevin

  • Hi Nick,

    The updated FCC and Ture FCC after battery resting is 1~2Ah less than the actual capacity, and the Ture RC is negative, about -1Ah~-2Ah, what could be the reason for this?

  • Hi,

    There is likely issue with the learning cycle or chemID. Can you upload the GPCCHEM report and logs showing negative True RC?

    Thanks,

  • Hi Nick,

    There are 3 GPCCHEM reports and 1 log.

    report and log.zip

  • Hi,

    The difference you are seeing from the battery spec is likely due to the higher IR loss from high discharge rate. Do you have logs showing negative RC?

    I would suggest you make a separate e2e posts for the other packs, Is there 3 correct?

    Best regards,

  • Also not that the battery is rated at 3500mAh at a .67C discharge, your discharge rate is considerably higher.

    BR,

  • Hi,

    I don't have the full logs, only the logs after the resting, as shown below, which are also available in the .zip file.I can re-collect the data if needed.

  • Hi,

    From the battery datasheet the 3500mAh rating is at .67C, you are doing a a lot higher. Not much we can do here.

    Best regards,

  • Hi Nick,

    The maximum continuous discharge current of the cells is 10A, and the battery pack is 7S3P, we used 30A current for the test.
    Using 20A test also found that Ture FCC is also much less than the actual capacity.

    The analysis results of the three battery packs all have the Chemistry ID 1580. Can it be considered that there is no problem with using the Chemistry ID?

    Best regards,

  • The chemID should be ok, the deviation is low ( < 3%). The negative RC is something I can help with but we'll need to see a more detailed log of how the gauge is getting into this condition.

    Best regards,

  • I found that the larger the value of Avg I Last Run, the smaller the capacity.

    5700.1.gg.csv

    Best regards,

  • Hi,

    When the battery heats up the resistance goes down, giving more capacity, then it cools down at the lower voltage. The negative value is due to trueRC being re-sim at the lower temperature when an OCV reading is taken.

    Best regards,

  • Can this problem be solved?

    Best regards,

  • We can look into this more will get back to you tomorrow.

    BR,

  • Hi

    This is the normal operation for the gauge, if you want remcap to not go below 0 the filtered one is capped.

    Best regards,

  • Hi,

    Ture RC causes Ture FCC to become smaller than its actual capacity, which we feel is not normal operation and makes users feel that there is something wrong with the battery.

    Best regards,

  • Hi,

    I would suggest you to contact your battery manufacturer to provide a capacity spec when using a 6C discharge.

    Best regards,

  • Hi,

    I have reviewed your log file. For this case the gauge seems to be behaving as expected. During your high load the capacity you get out of the battery will be greatly reduced due to the added IR loss in the battery voltage. At such a high rate your temperature increases very rapidly which reduces the overall impedance of the cell, which grants you "extra" capacity. When the load is removed the temperature settles back to normal which increases the impedance resulting in your battery being "over discharged". The negative true remaining capacity is a true property of the battery. The manufacturer specs the minimum amount of capacity you will get from the cell under specific load conditions. The high the current you use the less you will get. 

    The gauge is recalculating that if you hit the battery with the high load rate that it was using at that given temperature your battery voltage will fall below termination voltage immediately since it will not have the time to heat prior to termV being reached. I suggest running a test where you discharge all the way to empty on the first run so you can see the true capacity you get out of the cell [Passed Charge]. Then repeat this test but after you remove the load apply another discharge until terminate voltage. Only with these two log types can we know true accuracy. 

    It is possible there is some error in our estimation, but at such a high late battery thermals and the batteries OCV profile play a huge role. There is added inaccuracy with the bq34z100 due to the voltage measurement through the resistor divider. 

    Thanks,

    Eric Vos

  • Hi,

    Are the test steps what I think they are?Is there a requirement for current? If not I would use 30A current to discharge the battery.

    1、Reburn the .senc file with a fully charged battery and enable the IT algorithm.
    2、Discharge the battery to the termination voltage, remove the load and wait for the Qmax update to finish.
    3、Repeat step 2.

    Best regards,

  • Hi,

    As the data we were looking at is for 20A you may want to start there.

    Best regards,

  • Hi,

    Thank you for your reminder, we will have a holiday soon, and the test will be conducted in three weeks.

    Best regards,

  • Hi,

    Can I turn up the termination voltage for this test, the current termination voltage is set to 2.5V, discharging to below 2.5V will easily damage the battery.

    Best regards,

  • Hi,

    This is the test record, I feel that the Avg I Last Run parameter is the cause, the larger this value is the less battery capacity, it seems to have no great relationship with temperature.
    Avg I Last Run=-299(default,-916mA), True FCC=2626(10504mAh), True RC=81(324mAh);
    Avg I Last Run=-5010(-20040mA), True FCC=2214(8856mAh), True RC=-332(-1328mAh);

    20A Test.xlsx

    Best regards,

  • Hi,

    The gas gauge seems to change the True RC and True FCC according to the current (User Rate-mA, User Rate-Pwr, Avg I Last Run and Avg P Last Run).
    I reset the gas gauge after modifying these parameters and can observe obvious changes.
    Compared with the True FCC and True RC observed after relaxation, the difference is not very large, and both are much less than the actual capacity.

    Best regards,

  • User6362354,

    This is an expected result. The higher your expected load current the less capacity you will get out of your battery. When you are near full and start a discharge at the high rate the gauge is expecting the battery internal temp to rise, which will decrease the internal resistance. When you are empty the battery will  not have the time to self-heat. So resting near empty you will get less "remcap" with the higher loads.

    Thanks,

    Eric Vos

  • Hi,

    The actual capacity that can be released is much larger than True FCC, which seems to have the problem of inaccurate battery capacity. Can this problem be solved? If this problem cannot be solved, I cannot proceed to the next step.

    Best regards,

  • Hi,

    Can you upload a log of the battery discharging from full to empty at 20A? What is the passed charge? 

    Best regards,

  • Hi,

    The passed charge is DOD0 Passed Q.

    20A.xlsx

    Best regards,

  • The passing capacity recorded on the electronic load is 10237mAh.

  • Hi,

    After the SOC reaches 4%, it drops very slowly, which is not normal. It takes 5 minutes to drop to 0%, which accounts for one-sixth of the total discharge time.

    Best regards,

  • Hello,

    I am going to take a deeper dive into this application use case. Please look for an update from me early next week. 

    One thing I am unable to find through this thread are the files provided into the GPC tool. Are you able to provide the raw GPC files to me?

    One thing I notice from the start is in your GG file's Ra table is not an exponential growth shape. The Ra grid 14 is smaller than the previous grid. This indicates there was an error in your golden image creation. There is no way a deeper grid should be smaller (outside of grid 3 or 4) than the previous grid. 

    Thanks,

    Eric Vos

  • Hello,

    OBelow are 3 copies of the original GPC file, where 0.zip is the data collected from the new battery and the other two are the data collected from the 2 already used batteries.

    raw GPC files.zip

    Thanks,

  • Hello,

    The latest x20A.xls log you sent, do you have the gg file from that run. An earlier GG file i found only had a QMax of ~2K, while the log shows 10K. 

    Please provide the correct GG for analysis.

    Thanks,

    Eric Vos

  • Hello,

    Sorry, this file has been processed by me and some of the data is not the original value, I will resend it to you below.

    Please let me know if there is any progress.

    0726.gg and log.zip

    Thanks,

  • There are two issues, which are not independent from each other:

    1. The gauge doesn't predict temperature correctly for your system. Your battery heats up to around 80deg.C during discharge. The gauge doesn't predict temperature that high and therefore it will not account for the additional capacity that becomes available at such high temperatures.

    2. The gauge doesn't adjust cell resistance down enough to estimate the correct additional capacity at high temperatures.

    How did you obtain the ChemID? Did TI create a custom one or did you use GAUGEPARCAL? Note that the latter uses room temperature data to find a matching ChemID - this may not be adequate if there is an *extreme* change in temperature like in your case where the battery gets extraordinarily hot.

    I adjusted the battery model (parts of the ChemID) and the thermal prediction in simulations which will avoid the large fluctuations in FCC. I need to know the history of how you configured the gauge before I can suggest what to change for the actual configuration.

  • 1. What is the current temperature range that can be predicted by the pressure gauge?

    2. At the beginning, I knew that the battery model was Sanyo NCR18650GA(7S3P), so the ChemID I chose was 0x1580. After the test, I found that there were problems with abnormal capacity and unsmooth soc curves. Then I used GPC tools to analyze 3 batteries (using BQ34Z100-G1 Collected data), one is a new battery (No. 0), and two are used batteries (No. 1 and No. 3). The analyzed Best chemical IDs are different. The following is a simple comparison. The Chem ID I currently use Compared with Best chemical ID, I also provide raw GPC files and GPC report files.

    6521.raw GPC files.zip

    GPC report files.zip

    Battery number

    Chem ID

    max DOD error, %

    Max R deviation, ratio

    0

    1580

    2.73

    0.58

    1

    1580

    2.21

    0.47

    3

    1580

    2.26

    0.63

    Battery number

    Best chemical ID

    max DOD error, %

    Max R deviation, ratio

    0

    2348

    1.87

    0.67

    1

    2412

    1.56

    0.54

    3

    2412

    1.6

    0.73

    3. Below I will provide the configuration file. This is the latest configuration. The current configuration is not the latest configuration. There are some minor differences. The current-related configuration will be scaled by 4 times, among which: Res Current and Qmax Max Delta% remain the firmware default values. I found that scaling Res Current cannot be successfully learned. The unit of Qmax Max Delta% should be a percentage, without scaling.

    1)Basic Configuration

    CLASS

    SUBCLASS

    NAME

    STANDARD

    SCALE 4X

    UNIT

    Configuration

    Safety

    OT Chg

    650

    -

    0.1°C

    Configuration

    Safety

    OT Chg Time

    10

    -

    s

    Configuration

    Safety

    OT Chg Recovery

    600

    -

    0.1°C

    Configuration

    Safety

    OT Dsg

    800

    -

    0.1°C

    Configuration

    Safety

    OT Dsg Time

    10

    -

    s

    Configuration

    Safety

    OT Dsg Recovery

    750

    -

    0.1°C

    Configuration

    Charge Termination

    Taper Current

    100

    25

    mA

    Configuration

    Charge Termination

    Cell Taper Voltage

    100

    -

    mV

    Configuration

    Charge Termination

    TCA Set %

    -1

    -

    %

    Configuration

    Charge Termination

    TCA Clear %

    98

    -

    %

    Configuration

    Charge Termination

    FC Set %

    -1

    -

    %

    Configuration

    Charge Termination

    FC Clear %

    98

    -

    %

    Configuration

    Data

    Cycle Count

    0

    -

    Counts

    Configuration

    Data

    CC Threshold

    9315

    2329

    mAh

    Configuration

    Data

    Design Capacity

    10350

    2588

    mAh

    Configuration

    Data

    Design Energy

    3726

    932

    mWh

    Configuration

    Data

    Design Energy Scale

    10

    -

    Num

    Configuration

    Registers

    Pack Configuration

    2999

    -

    flags

    Configuration

    Registers

    Alert Configuration

    0

    -

    flags

    Configuration

    Registers

    Number of series cell

    7

    -

    Num

    Configuration

    Power

    Sleep Current

    10

    3

    mA

    Configuration

    Power

    FS Wait

    0

    -

    s

    Gas Gauging

    IT Cfg

    Cell Terminate Voltage

    2500

    -

    mV

    Gas Gauging

    Current Thresholds

    Dsg Current Threshold

    30

    8

    mA

    Gas Gauging

    Current Thresholds

    Chg Current Threshold

    50

    13

    mA

    Gas Gauging

    Current Thresholds

    Quit Current

    25

    6

    mA

    Gas Gauging

    State

    Qmax Cell 0

    10350

    2588

    mAh

    Gas Gauging

    State

    Cycle Count

    0

    -

    Num

    Calibration

    Current

    Deadband

    20

    5

    mA


    2)Scaling Configuration

    CLASS

    SUBCLASS

    NAME

    STANDARD

    SCALE 4X

    UNIT

    Configuration

    Charge Termination

    Taper Current

    100

    25

    mA

    Configuration

    Charge Termination

    Min Taper Capacity

    25

    6

    mAh

    Configuration

    Charge Termination

    NiMH Hold Off Current

    240

    60

    mA

    Configuration

    Data

    CC Threshold

    9315

    2329

    mAh

    Configuration

    Data

    Design Capacity

    10350

    2588

    mAh

    Configuration

    Data

    Design Energy

    3726

    932

    mWh

    Configuration

    Data

    SOH Load I

    -400

    -100

    mA

    Configuration

    Discharge

    SOC1 Set Threshold

    150

    38

    mAh

    Configuration

    Discharge

    SOC1 Clear Threshold

    175

    44

    mAh

    Configuration

    Discharge

    SOCF Set Threshold

    75

    19

    mAh

    Configuration

    Discharge

    SOCF Clear Threshold

    100

    25

    mAh

    Configuration

    Lifetime Resolution

    LT Cur Res

    100

    25

    mA

    Configuration

    Power

    Sleep Current

    10

    3

    mA

    Gas Gauging

    IT Cfg

    Res Current

    Firmware Default

    Firmware Default

    mA

    Gas Gauging

    IT Cfg

    User Rate-mA

    0

    0

    mA

    Gas Gauging

    IT Cfg

    User Rate-Pwr

    0

    0

    mW/cW

    Gas Gauging

    IT Cfg

    Reserve Cap-mAh

    0

    0

    mAh

    Gas Gauging

    IT Cfg

    Reserve Energy

    0

    0

    mWh/cWh

    Gas Gauging

    IT Cfg

    Qmax Max Delta %

    Firmware Default

    Firmware Default

    mAh

    Gas Gauging

    Current Thresholds

    Dsg Current Threshold

    30

    8

    mA

    Gas Gauging

    Current Thresholds

    Chg Current Threshold

    50

    13

    mA

    Gas Gauging

    Current Thresholds

    Quit Current

    25

    6

    mA

    Gas Gauging

    State

    Qmax Cell 0

    10350

    2588

    mAh

    Gas Gauging

    State

    Avg I Last Run

    –299

    -75

    mA

    Gas Gauging

    State

    Avg P Last Run

    –1131

    -283

    mWh

    Calibration

    Current

    Deadband

    20

    5

    mA

    Here is a gg file running the learning cycle and a gg file exported from the official firmware.

    1588.learning cycle.csv

    bq34z100G1FirmwareBundle-0.16.gg.csv

  • Hello,

    How is it going now? I re-learned a used battery (the capacity seems to be attenuated). Modify the scale of 2.After the 20A discharge and let it stand, the updated capacity is a bit larger than before, about 9500mAh. This is the log file.

    2046.xlsx

    Thanks,

    mengxiao

  • Hello, many days have passed, please let me know the progress.

  • Hello, this post for a long time no new news.