This thread has been locked.

If you have a related question, please click the "Ask a related question" button in the top right corner. The newly created question will be automatically linked to this question.

PROCESSOR-SDK-J7200: Unexpected ESR_EL3 value on mpu1_0 at the entry point

Part Number: PROCESSOR-SDK-J7200

HI,

I'm trying to use ti-processor-sdk-rtos-j7200-evm-08_00_00_12 with CCS 10.4 on the J721EXCP01EVM board.

I have successfully built a uart_test program (@ pdk_j7200_08_00_00_37\packages\ti\csl\example\uart\uart_test) for mpu1_0.

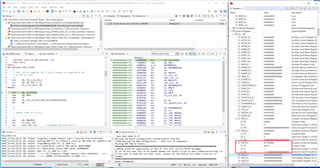
In debugging on CCS 10.4, I found ESR_EL3 on mpu1_0 indicated an error value just after loading the program above as shown in the attached figure below.
(I followed [1] for CCS setup)

[1] software-dl.ti.com/.../ccs_setup_j7200.html

I guess that this error is derived from a GEL file. Does a release version binary booted from SBL have the same problem too?

Other proprietary (my own) programs for mpu1_0 and mpu1_1 which run with AArch64/EL1 receive an unexpected synchronous exception with ESR_EL1 = 0x02000000 after 30min or 1hour execution. This error is classified into "unknown reason" at [2].

[2] developer.arm.com/.../ESR-EL1--Exception-Syndrome-Register--EL1-

ESR_EL1 0x02000000  Exception Syndrome Register (EL1) [Core]    
    EC  000000  Exception Class 
    IL  1   Instruction Length (1=32 bits)  
    ISS 0000000000000000000000000   Instruction Specific Syndrome
 

I investigated the root cause for that, but I cannot find it yet. The program seemed to operate without any problem because code, stacks and CPU registers seemed correct when a target cpu core received the synchronous exception

Even in this scenario,  the ESR_EL3 value of both mpu1_0 and mpu1_1 just after loading each program binary was 0x62383011. However, the ESR_EL3 value became 0x1FE00000 (as shown in the attached figure) just after 1-step over execution on CCS.

ESR_EL3	0x62383011	Exception Syndrome Register (EL3) [Core]	
    EC	011000	Exception Class	
    IL	1	Instruction Length (1=32 bits)	
    ISS	0001110000011000000010001	Instruction Specific Syndrome	

So, I'm now suspecting that A72 cores become invisibly unstable due to wrong initialization by a GEL file (or SBL), then they are capable of causing other errors.

Many thanks,

  • Hello,

    Scanning your comments it appears like you are able to build a custom application and also some of the unit tests in the ti-processor-sdk-rtos-j7200-evm-08_00_00_12 SDK.  The main issue you are hitting is your custom application takes an abort sometime between 30-minutes and 1 hour.   Since you are not seeing any obvious clues in the registers you are question some of the initial state conditions.  Chances are if the initial conditions were off in a meaningful way the system would have crashed in the first seconds of execution.

    Do any of the TI examples crash after 1 hour or is it just your custom code?  Your first time is best spent understanding the conditions around the actual observed error.   How do debug at the error time does depend on your code and what its doing.

    Is this code running on a TI EVM or is this on your custom board?  What is the nature of this code is it low level with no expected exceptions or is it some RTOS which has a lot of complex state?

    If the code is not expecting exceptions its best to just set a break point on the exception vectors and inspect the full register set at entry time.  For synchronous exceptions the ELR likely points at you what code caused the issue.  If the MMU is enabled then FAR also can have useful information.   In this type of situation using A72 ETM processor trace can be useful as it will be possible to see the execution context ahead of the error.

    I have run the UART test on 7.SDKs and did not see a 0x62383011 at the start time.   Generally the PDK examples are tested against the NOBOOT boot mode settings via DIP switches.  Was this used in your test?  Looking in a decoder it looks like some MSR/MRS was executed with bad parameter.  If a boot mode was used which touched a lot of state the loaded code may have interrupted something.

    For the 0x1FE00000 I've seen similar things if the boot code executes some SIMD instruction but has not fully enabled all necessary gates.  Recently I saw some code which failed unless CPTR_EL3.TFP was explicitly cleared.  It is a register which does not have a defined reset state and can cause SIMD fails.

    Generally speaking based on many debugs, the most productive time for debugging should be with your code at its failure time.  Looking at initial state at an 'unclean' start time likely is not productive.   I don't expect a natively run SPL will have issues like seen with 'forcing' the system with JTAG.  The SBL isn't that robust under errors and would crash and demand a fix to work at all.

    Regards,

    Richard W.

  • Hi,

    Thanks for providing your comments.

    Do any of the TI examples crash after 1 hour or is it just your custom code?  Your first time is best spent understanding the conditions around the actual observed error.   How do debug at the error time does depend on your code and what its doing.

    It is just my own code for stress testing. I have not examined this exception with any of TI examples.
    (Is there any TI example which can continue to run 30 minutes or longer? I will try it if it exists)
    This exception does not occur a specific situation, it occurs in a variety of contexts. However, it has always ESR_EL1 = 0x02000000.

    Is this code running on a TI EVM or is this on your custom board?  What is the nature of this code is it low level with no expected exceptions or is it some RTOS which has a lot of complex state?

    This code was running on a TI EVM board (J721EXCP01EVM). It employs a proprietary RTOS. Therefore, its behavior is not so simple as you mentioned. 

    If the code is not expecting exceptions its best to just set a break point on the exception vectors and inspect the full register set at entry time.  For synchronous exceptions the ELR likely points at you what code caused the issue.  If the MMU is enabled then FAR also can have useful information.   In this type of situation using A72 ETM processor trace can be useful as it will be possible to see the execution context ahead of the error.

    I have already checked ELR and FAR registers. They did not seem to behave wrong or strange.
    1) FAR_EL1 was always 0x0 even after a target CPU core received the synchronous exception (with the MMU-enabled configuration).
    2) ELR_EL1 indicated a variety of memory address (Case1-3) as shown below. However, the issued instruction just before receiving the exception seemed correct. 

    (Case 1)
    - ELR_EL1 regsiter
        ELR_EL1	0x0000000070001788	Core	
    - Code near ELR_EL1
    -> I have confirmed memory addresses stored in X0 used for each ldr instruction were valid.
    000000007000177c:   F9400FE0    ldr        x0, [sp, #0x18]
    0000000070001780:   F9400000    ldr        x0, [x0]
    0000000070001784:   B9400000    ldr        w0, [x0]
    0000000070001788:   12003C00    and        w0, w0, #0xffff
    000000007000178c:   B90027E0    str        w0, [sp, #0x24]
    
    (Case 2)
    - ELR_EL1 regsiter
    	ELR_EL1	0x0000000070001508	Core	
    - SP, SP_EL{0,1} registers
    	SP	    0x000000008010EBC0	Stack Pointer [Core]	
    	SP_EL0	0x00000000804177C0	Core	
    	SP_EL1	0x000000008010EBC0	Core	
    - Code near ELR_EL1
    -> Our program uses SP_EL0 rather than SP_EL1 in this context, so 'sp' below should indicate near 0x804177C0 (Of course, I have confirmed this memory region was valid configured by MMU).
    0000000070001504:   B9402FE0    ldr        w0, [sp, #0x2c]
    0000000070001508:   A8C37BFD    ldp        x29, x30, [sp], #0x30
    000000007000150c:   D65F03C0    ret 
    
    (Case 3)
    - ELR_EL1 regsiter
    	ELR_EL1	0x0000000070025B08	Core	
    - Code near ELR_EL1
    0000000070025b00:   90088F25    adrp       x5, #0x81209000
    0000000070025b04:   913B00A2    add        x2, x5, #0xec0
    0000000070025b08:   52800041    mov        w1, #2
    0000000070025b0c:   39008801    strb       w1, [x0, #0x22]

    I have run the UART test on 7.SDKs and did not see a 0x62383011 at the start time.   Generally the PDK examples are tested against the NOBOOT boot mode settings via DIP switches.  Was this used in your test?  

    Yes, I tried my evaluation under the NOBOOT boot mode.

    Many thanks,

  • Is it possible to run your code fully from MSMC SRAM or is DDR required?  The GEL files generally capture early DDR settings.  As the part is qualified across all conditions the timing are refined.  A run using internal memories only would help rule out some DDR related issue.  Errors which appear somewhat random is an attribute of not using final timings.   As I mention I tend to use ETM trace to help debug this kind of issue.  A halt trigger when the error is first seen allows for deep inspection of history.  The 64k onchip buffer may hold 10's of milli-seconds of history.  Streaming to a 4GB offchip receiver can offer minutes.  For off chip streaming I often use TRACE32 from Lauterbach.  CCS or TRACE32 will work for onchip. The MMU setup can be tricky, an audit using the TRACE32 decoder is often enlightening, in my experience it has found issues from low level (bare/rtos) to high (linux/qnx).  

    If you are worried about JTAG state forcing effects you can move to an boot from SBL or some supported bootloader.

  • Hi,

    I had further investigation and found that this issue was caused due to the lack of L2 cache latency setting in our start-up code.

    Your start-up code at [1] has a reference to PD.
    Could you please provide information on i) what "PD" means and ii) where I can find the correct latency value for J7200?

    [1] https://git.ti.com/cgit/keystone-rtos/common-csl-ip/tree/arch/a53/src/startup/aarch64/bootcode.asm?h=REL.CORESDK.08.00.03.17#n64

    Many thanks,

  • Hello,

    Your finding makes sense vs. the symptoms you observed. Moreover, I have experienced memtester failures when running bare metal code which did not set the latency to the value you highlighted from our CSL.  I did NOT observe the same ESR value you reported, but I did see pattern failures.

    I believe PD means 'physical design' in this context.  The PD team inspects an end design from multiple physical angles. I have a recollection that the latency value used in the code was required to pass their tests with sufficient margin @2GHz. This requirement has been verified by low level software. The A72 in J7ES or J7200 requires the same value for that speed range.

    Regards,

    Richard W.

  • Hi,

    Thanks for providing the information.

    Could you please add description on the cache latency setting to your technical reference manual? I could not find it in the latest manual for J7200 (Literature Number: SPRUIU1A JULY 2020 - REVISED JANUARY 2021).
    I have confirmed that other processor vendors have a dedicated section on the cache latency setting for ARMv8-A cores in their processor reference manuals.

    Many thanks,

  • Hello,

    Yes, I can submit a request to update the A72 section in the TRM to include guidance for the L2 cache latency setup.  This request may be superfluous as already the underlying internal compute cluster specification has the update which requires the L2CTLR_EL1 to be set to 3 cycles for A72s @2GHz.  The source spec updates should be auto-pulled into a future TRM update.

    Regards,

    Richard W.

  • Hi,

    Thanks for your consideration.
    I will close this topic.