This thread has been locked.

If you have a related question, please click the "Ask a related question" button in the top right corner. The newly created question will be automatically linked to this question.

AM5K2E02: Debugging a Core Stall

Part Number: AM5K2E02

Hi All,

We are having an issue with a core stall / hang / lock up, with a custom board.

While we are operating in a single core configuration, we do not believe this issue is related to Errata #798870 as we:

  • have the Hazard Detect timeout bit set in L2ACTLR
  • have a periodic DMA running as per the workaround (which continues to operate after stall)
  • have observed the stall even with the L2 Cache disabled (C-bit in SCTLR clear) 
  • can regularly experience the stall within a couple of minutes

We have confirmed that the peripherals we are accessing (DDR3, PCIe) still respond by accessing them over DAP.

We currently use a Lauterbach probe; recently we had a similar stalling issue which was alleviated by changing the commands used to connect the probe. For our probe, using "System.up" to initially connect caused a version of our application to stall in the same section every time (i.e. we connect with "system.up", load the bootloader, run the bootloader, load the image, run the image, then it stalled in roughly the same area each time). To fix this we found that using "system.attach" followed by a "break.direct", or running the application without the debugger connected (physically or otherwise) did not result in a stall.

The both commands initialise the debug/jtag port; the difference is that attach does not perform a reset, and does not stop the change the processor state.

Unfortunately, disconnecting the debugger physically still results in our current stall situation. We do not know if this is a separate stall issue, or if the debugger was exacerbating the same stall issue.

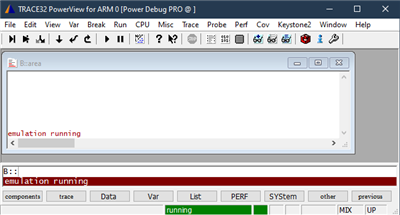
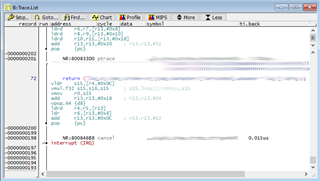
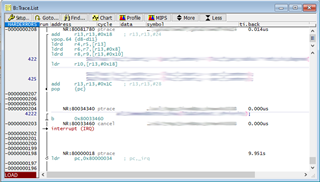
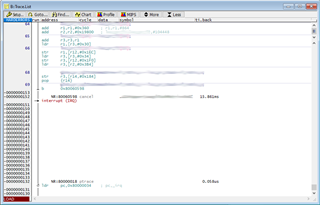
We would like to be able to interrogate the core and check what state it is in but, due to the stall, all access to and control over the core via the debugger ceases. For example, trying to halt execution results in the debugger throwing an "Emulation running" error; and trying to access core registers results in failure and "bus error"s.

Are there any steps we can take to try to work out what is happening and why? Are there any registers we can/should interrogate to see the internal status of the SoC?

Many thanks

  • HI Daniel,

    Would you please post the screenshot of the  "Emulation running" error ? 

    Regards

    Shankari G

  • Hi Shankari,

    Here is a screenshot of the Lauterbach tool (Trace32) showing the "Emulation Running" error after trying to pause execution (command "break.direct").

    As you can see, the tool is reporting that it thinks the processor is still running.

    Emulation Running Error in Lauterbach tool

  • Daniel,

    For AM5K2E02, the recommended development tools for TI processors is CCS and XDS emulators ( debug probes.)

    As far as I know, I don't think we can get support for Lauterbach tool.

    Customer says " (i.e. we connect with "system.up", load the bootloader, run the bootloader, load the image, run the image, then it stalled in roughly the same area each time)"

    By any chance, if you purchased K2E Development board, it will have on-board XDS emulator. You can verify the same image by loading and running. By this way, we can narrow down whether it is a problem of debug-probe or the processor-stall or the app-hang etc. And check whether it gets stalled at the same code each time.

    And also, using the Lauter bach tool, try running some other working example/image which comes with SDK for AM5K2E02. Through this, we can narrow down whether the app is causing problem. Try the same with XDS debug probes if your custom board supports...

    Regards

    Shankari

  • Hi Shankari,

    We do have some XDS200 probes available to us, but our development environment is not currently set up to use them. We also have some of the 66AK2E EVM boards available to us, but our custom OS/application does not support that board in its current configuration, especially as we are interfacing with a number of external devices not available on that EVM.

    I think we can exclude the debug probe as being the cause because we still get the stall when the debugger is not physically connected.

    Our application runs baremetal with no OS/RTOS; and is a prototype for our custom RTOS.

    The application currently serves as a demonstrator, and a benchmarking tool; we have an older version of the same application where most of the overall framework is identical, but with fewer of these benchmarking functions. We can still run that older application revision and we do NOT receive any stalls, even when the same benchmark is being run.

    In the previous lockup scenario, changing array sizes (e.g. to allow more benchmarking trial runs) which would cause the memory layout to change around slightly, moved the lockup location when running the benchmarks. Sometimes, the lockup wouldn't occur after a layout change, but would return with a value change.

    I have run the application a few times with ETM tracing enabled; each time the last branch point logged is an IRQ/interrupt before the lockup occurs. However this code for the interrupt handler has NOT been touched since the aforementioned working non-stall application.

    For reference, we have an interrupt firing roughly every 15ms (but we can slow it to every 100ms and still get stalls). It is coming from an MSI interrupt from a PCIe device. Our handler does three things: 1. increment a counter. 2. Clear the PCIe MSI interrupt. 3. Write to a register on the device to indicate it can raise another interrupt.

    I've had to blur out some identifying information in the traces due to the nature of the code. The number on the left with a minus sign is the Trace record number, which counts how many records are left until trace end. Where a line reads "ptrace" is a trace from the ETM, and usually occurs wherever there is a branch or other traceable execution point. Any source lines are interpolated from the known source code using the stored PC in the trace records.

    Hopefully these images show that the only place which appears to be common between each stall is the interrupt handler. However prior to the stall events, the exact same interrupt handler executes 1000s of times with no problem. 

    Trace 1

    Trace 1

    Trace 2

    Trace 2

    Trace 3

    Trace 3

    Trace 4

    Trace 4

    Additionally, this is the same as Trace 4, but at an earlier Interrupt invocation. This includes our IRQ Exception handler, but I've excluded the Interrupt handling code for the same reason as above.

    Good Trace, entering exception handlerGood trace, start of Exception handlerGod trace, end of handler & leaving

    Again, any advice on which registers/addresses to probe or configure to give us an idea as to why the core is stalled, i.e. waiting on a memory transaction, is much appreciated.

    We're having discussions internally, and because of the focus on the interrupt handler, we are leaning towards it possibly being PCIe related. Again, if you could suggest some registers/addresses; which we can check pre- and post-stall to confirm/rule-out PCIe as the cause, that would be helpful.

    Many Thanks.

  • Ahh, sorry, a quick correction here:

    Our handler does three things: 1. increment a counter. 2. Clear the PCIe MSI interrupt. 3. Write to a register on the device to indicate it can raise another interrupt.

    In this version of our code, we are not writing to the PCIe device (that's a different setup). 

    Also for clearing, we are writing to the appropriate MSIn_IRQ_STATUS register, and to the IRQ_EOI register, appropriately.

  • Daniel,

    Thanks for your detailed explanation.

    For PCIe related issues, let me discuss with my team and get back to you. (Please note, as-far-as-I-know, time-being, only limited support will be available for PCIe.

    Regards

    Shankari G

  • Hi Shankari,

    Regarding PCIe, I've just finished some further testing.

    I enabled all of the error interrupts (ERR_IRQ_ENABLE @ offset 0x1C8) and power interrupts (PMRST_IRQ_ENABLE @ offset 0x1D8); and I created handlers for these interrupts.

    During execution, these interrupts did NOT trigger.

  • Daniel,

    Please give some time for us to hear from PCIe experts.

    Thanks for your patience.

    Regards

    Shankari G

  • While we were trying to narrow down the issue, by implementing some fixes for possible Errata (including those which are claimed to be fixed for the r2p4 core revision); we had performed a full clean and rebuild of the application.

    Doing the full clean and rebuild seems to have fixed our issue. We have not experienced a lock up since doing so (the benchmark we had which used to lock within 30 seconds ran continuously for 2+ hours with no locks).

    We are hesitant to claim this has fully fixed the issue. We will be performing a long running test over the weekend to give some confidence.

    I will update again next week with the results.

  • Daniel,

    That's a good news.  Congrats!

    As, you said, this may seem to be an intermittent issue. 

    If time permits, Please, also share your fixes, that you mentioned for Errata; So that, the Forum members will get to know.

    ( Meanwhile, due to "Thanks-giving" holidays, I have not heard from PCIe, experts from our end. Sorry!)

    Regards

    Shankari

  • Apologies for the delay. Our weekend long trial resulted in no locks. We are now more confident that the issue is related to a corrupt build environment. Our solution to this is therefore: Ensure the build environment is clean prior to building.

    Regarding the errata fixes; we looked primarily at those in the ARM Cortex-A15 Errata document which could result in a stall, livelock, deadlock, etc. And we followed fixes listed therein (i.e. set appropriate bits, use DSBs, etc). However, as mentioned, some of these errata do not affect the revision of silicon on this chip. 

  • Thanks Daniel.

    Great!.