This thread has been locked.

If you have a related question, please click the "Ask a related question" button in the top right corner. The newly created question will be automatically linked to this question.

PROCESSOR-SDK-J784S4: CSITX1 error

Part Number: PROCESSOR-SDK-J784S4
Other Parts Discussed in Thread: TDA4VH, TDA4VM

Tool/software:

Hello TI,

We are working on the custom board based on the TDA4VH, and are using PROCESSOR-SDK-J784S4 v10.

We are performing bringup of the ECU, CSI_TX1 instance and are facing following issues:

When we run the apps on both sides (first we run the rx side, then tx side), RX side does not receive anything.

  • Capture status shows 4 frames (default error buffer).
  • On the CSI_TX side, we are sending raw image in the while loop. No failures reported in the log during app execution.
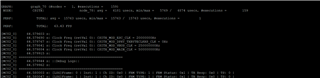
  • Below is printout of the TDA4 registers with the devmem2 :

root@j784s4-evm:~# devmem2 0x04414000
/dev/mem opened.
Memory mapped at address 0xffff844e2000.
Read at address  0x04414000 (0xffff844e2000): 0x021A202C
root@j784s4-evm:~# devmem2 0x04414004
/dev/mem opened.
Memory mapped at address 0xffff948b2000.
Read at address  0x04414004 (0xffff948b2004): 0x000000A0
root@j784s4-evm:~# devmem2 0x04414008
/dev/mem opened.
Memory mapped at address 0xffff8f634000.
Read at address  0x04414008 (0xffff8f634008): 0x0000000F
root@j784s4-evm:~# devmem2 0x0441400C
/dev/mem opened.
Memory mapped at address 0xffff7fa69000.
Read at address  0x0441400C (0xffff7fa6900c): 0x0000F0F0
root@j784s4-evm:~# devmem2 0x04414010
/dev/mem opened.
Memory mapped at address 0xffff9e33f000.
Read at address  0x04414010 (0xffff9e33f010): 0x00000000
root@j784s4-evm:~# devmem2 0x04414014
/dev/mem opened.
Memory mapped at address 0xffff80ad2000.
Read at address  0x04414014 (0xffff80ad2014): 0x00000000
root@j784s4-evm:~# devmem2 0x04414020
/dev/mem opened.
Memory mapped at address 0xffff8c5d4000.
Read at address  0x04414020 (0xffff8c5d4020): 0x80000030
root@j784s4-evm:~# devmem2 0x04414028
/dev/mem opened.
Memory mapped at address 0xffff8e149000.
Read at address  0x04414028 (0xffff8e149028): 0x0000111F
root@j784s4-evm:~# devmem2 0x04414034
/dev/mem opened.
Memory mapped at address 0xffff912c9000.
Read at address  0x04414034 (0xffff912c9034): 0x00000000
root@j784s4-evm:~# devmem2 0x04414038
/dev/mem opened.
Memory mapped at address 0xffffb6a83000.
Read at address  0x04414038 (0xffffb6a83038): 0x00001F0F
root@j784s4-evm:~# devmem2 0x04414084
/dev/mem opened.
Memory mapped at address 0xffff91905000.
Read at address  0x04414084 (0xffff91905084): 0x0B58044C
root@j784s4-evm:~# devmem2 0x04414040
/dev/mem opened.
Memory mapped at address 0xffff8b4fc000.
Read at address  0x04414040 (0xffff8b4fc040): 0x00010000

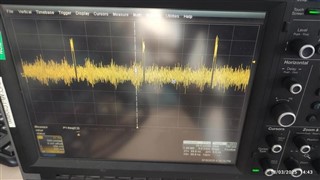
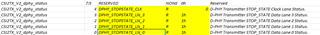
Regarding the serializer status:

  • global error status is asserted
  • PCLK is not detected

Do you have ideas, what might be the problem?

We are using 26Mhz input clock on TDA4VM.


Best regards,

Milena

  • Hi Milena,

    So you mean when both the examples CSIRX and CSITX are running together, you dont see any output from CSITX and also there is no capture, is that correct understanding? Are these two independent examples running on Linux? and individually are they working fine? 

    Regards,

    Brijesh

  • Hi Brijesh,

    We do have two instances of the same ECU, which are connected, as below. We are using Linux+ RTOS setup. CSI_RX/TX controlled from RTOS.

    ECU1 (CSI_TX1) - ECU1 (ser) <-> ECU2 (deser) - ECU2(CSI_RX0) 

    ECU2 is verified with camera . When we connect camera to the same port, it is working properly (CAM(sensor) - CAM (ser) <-> ECU2 (deser) - ECU2(CSI_RX0) )

    ECU1 (we have simple use case as explained above, generate image and send to CSI_TX1). Serializer configuration of ECU1 is done from the ECU2 side (in same order and similar manner as for the serializer in the camera).

    We have not verified this use case on ECU1(with some other devices, apart from these described tests)

    ECU2 does not receive any frames.

    Registers on the serializer show that GMSL link between ser and deser is locked, but PCLK is not detected.

    Best regards,

    Milena

  • Hello Milena,

    How are sending out the frame over CSITX? Are you using Vision Apps or some PDK based example? This is because the DPHY is shared between DSI and CSITX and there is a control module register to configure source of the DPHY. I am just wondering if it is using DSI as input and so there is no clock from the CSITX? 

    This is taken care in the vision apps in appCsi2TxInit API in imaging\utils\hwa\src\app_hwa.c file. 

    Regards,

    Brijesh 

  • Hi Brijesh,

    We do have vision_apps / reading from file and forwarding to the CSITX vision_app uploaded: /cfs-file/__key/communityserver-discussions-components-files/791/app_5F00_csitx-_2800_1_2900_.zip (modified application from this link: e2e.ti.com/.../tda4vh-q1-csitx-output-image-abnormally )

    We are using vision_apps, application is attached above.

    We have undef DSS_DSI, and defined only CSI_TX. Hope this removes all conflicts?

    In the init log, there is no DSS Init, only CSITX Init:

    [MCU2_0]     14.561543 s: FVID2: Init ... !!!
    [MCU2_0]     14.561686 s: FVID2: Init ... Done !!!
    [MCU2_0]     14.561759 s: SCICLIENT: Sciclient_pmSetModuleState module=275 state=2
    [MCU2_0]     14.561871 s: SCICLIENT: Sciclient_pmSetModuleState success
    [MCU2_0]     14.561906 s: Before appCsiTxConfigureMAX96717
    [MCU2_0]     14.562245 s: CSI_TX: Configuring MAX96717 Done!
    [MCU2_0]     14.562277 s: After appCsiTxConfigureMAX96717
    .....
    [MCU2_0]     14.600558 s: CSI2TX: Init ... !!!
    [MCU2_0]     14.600575 s: SCICLIENT: Sciclient_pmSetModuleState module=189 state=2
    [MCU2_0]     14.600628 s: SCICLIENT: Sciclient_pmSetModuleState success
    [MCU2_0]     14.600652 s: SCICLIENT: Sciclient_pmSetModuleState module=75 state=2
    [MCU2_0]     14.600710 s: SCICLIENT: Sciclient_pmSetModuleState success
    [MCU2_0]     14.600732 s: SCICLIENT: Sciclient_pmSetModuleState module=76 state=2
    [MCU2_0]     14.600796 s: SCICLIENT: Sciclient_pmSetModuleState success
    [MCU2_0]     14.600817 s: SCICLIENT: Sciclient_pmSetModuleState module=402 state=2
    [MCU2_0]     14.600867 s: SCICLIENT: Sciclient_pmSetModuleState success
    [MCU2_0]     14.600888 s: SCICLIENT: Sciclient_pmSetModuleState module=403 state=2
    [MCU2_0]     14.600950 s: SCICLIENT: Sciclient_pmSetModuleState success
    [MCU2_0]     14.601018 s: CSI2TX: Init ... Done !!!
    [MCU2_0]     14.601039 s: ISS: Init ... !!!
    [MCU2_0]     14.601078 s: IssSensor_IMX390_MAX9295A_Init start 
    [MCU2_0]     14.601110 s: IssSensor_IMX390_MAX9295A_Init end 
    [MCU2_0]     14.601130 s: IssSensor_Init ... Done !!!

    From the code in the app_hwa.c, I assume we are using DPHYTX1 as input for the CSITX1:

        /* Select CSITX0 as the source for DPHYTX0 */
        CSL_REG32_WR(CSL_CTRL_MMR0_CFG0_BASE +
                        CSL_MAIN_CTRL_MMR_CFG0_DPHY_TX0_CTRL,
                        0x1);
        #if defined(SOC_J721S2) || defined(SOC_J784S4)
        /* Select CSITX1 as the source for DPHYTX1 */
        CSL_REG32_WR(CSL_CTRL_MMR0_CFG0_BASE +
                        CSL_MAIN_CTRL_MMR_CFG0_DPHY_TX1_CTRL,
                        0x1);
        #endif

    Regards,

    Milena

  • Hi Milena,

    Can you please check if driver has the patch which i shared on below link? This is required to second CSITX instance in the driver. 

    /cfs-file/__key/communityserver-discussions-components-files/791/0001_2D00_CSITX_2D00_In_2D00_CsitxDrv_5F00_dphytxByteClkConfig_2D00_Wait_2D00_for_2D00_lane_2D00_-_2800_1_2900_.patch

    Regards,

    Brijesh

  • Also when you are sending the frames from ECU1, are you seeing that it is rotating buffers and showing correct fps? 

    Regards,

    Brijesh

  • Hi Brijesh,

    We do not have this patch on our side.

    Will include it.

    As for the performance statistics, we do not have common vision_apps statistics in this app, will add and check.

    Regards,

    Milena

  • Hi Brijesh,

    We have included the patch and statistics.

    Still PCLK is not detected on the serializer side.

    I see that CSI_TX is rotating some buffers:

    [MCU2_0]   2642.507320 s: [LOG]Frame: 0 | Inst: 1 | Ch ID: 0x0 | FRM TYPE: 1 | FRM Status: 0x1 | TR Resp: 0x0 | TS: 0 |
    [MCU2_0]   2642.507362 s: [LOG]Frame: 1 | Inst: 1 | Ch ID: 0x0 | FRM TYPE: 1 | FRM Status: 0x1 | TR Resp: 0x0 | TS: 0 |
    [MCU2_0]   2642.507403 s: [LOG]Frame: 2 | Inst: 1 | Ch ID: 0x0 | FRM TYPE: 1 | FRM Status: 0x1 | TR Resp: 0x0 | TS: 0 |
    [MCU2_0]   2642.507445 s: [LOG]Frame: 3 | Inst: 1 | Ch ID: 0x0 | FRM TYPE: 1 | FRM Status: 0x1 | TR Resp: 0x0 | TS: 0 |
    [MCU2_0]   2642.507487 s: [LOG]Frame: 4 | Inst: 1 | Ch ID: 0x0 | FRM TYPE: 1 | FRM Status: 0x1 | TR Resp: 0x0 | TS: 0 |
    
    1==========================================================
    [MCU2_0]   2642.511792 s: ==========================================================
    [MCU2_0]   2642.511846 s:   Channel Num | Frame Queue Count | Frame De-queue Count | Frame Repeat Count |
    [MCU2_0]   2642.511884 s:               0|              21717|          21717|          0|

    Regarding the FPS, statistics show 62-65 FPS. Not sure if this OK, and where is FPS set or how is calculated for CSI-TX?

    Devmem2 printout of the registers during use-case running (as far as I see) has not been changed:

    devmem2 0x04414000
    /dev/mem opened.
    Memory mapped at address 0xffffa904d000.
    Read at address  0x04414000 (0xffffa904d000): 0x021A202C
    root@j784s4-evm:~# devmem2 0x04414004
    /dev/mem opened.
    Memory mapped at address 0xffffad88a000.
    Read at address  0x04414004 (0xffffad88a004): 0x000000A0
    root@j784s4-evm:~# devmem2 0x04414008
    /dev/mem opened.
    Memory mapped at address 0xffffbb197000.
    Read at address  0x04414008 (0xffffbb197008): 0x0000000F
    root@j784s4-evm:~# devmem2 0x0441400C
    /dev/mem opened.
    Memory mapped at address 0xffff817cf000.
    Read at address  0x0441400C (0xffff817cf00c): 0x0000F0F0
    root@j784s4-evm:~# devmem2 0x04414010
    /dev/mem opened.
    Memory mapped at address 0xffff9c395000.
    Read at address  0x04414010 (0xffff9c395010): 0x00000000
    root@j784s4-evm:~# devmem2 0x04414020
    /dev/mem opened.
    Memory mapped at address 0xffffaeb5b000.
    Read at address  0x04414020 (0xffffaeb5b020): 0x80000030
    root@j784s4-evm:~# devmem2 0x04414028
    /dev/mem opened.
    Memory mapped at address 0xffffad393000.
    Read at address  0x04414028 (0xffffad393028): 0x0000111F
    root@j784s4-evm:~# devmem2 0x04414034
    /dev/mem opened.
    Memory mapped at address 0xffffa1987000.
    Read at address  0x04414034 (0xffffa1987034): 0x00000000
    root@j784s4-evm:~# devmem2 0x04414038
    /dev/mem opened.
    Memory mapped at address 0xffff88b6b000.
    Read at address  0x04414038 (0xffff88b6b038): 0x00001F0F
    root@j784s4-evm:~# devmem2 0x04414084
    /dev/mem opened.
    Memory mapped at address 0xffff9a932000.
    Read at address  0x04414084 (0xffff9a932084): 0x0B58044C
    root@j784s4-evm:~# devmem2 0x04414040
    /dev/mem opened.
    Memory mapped at address 0xffff896df000.
    Read at address  0x04414040 (0xffff896df040): 0x00010000
    root@j784s4-evm:~#

    Additional question:

    We are setting w: 1936 and h: 1096 and meta_height_after 4, meta_height_before 0.

    But in the driver at some point we see that these values change to 1920 x 1080.

    Any idea why these changed?

    Full log attached (with logs from driver, print statistics and debugFrameLog from driver).

    /cfs-file/__key/communityserver-discussions-components-files/791/csi_5F00_tx-2.txt 

    Best regards,

    Milena

  • Hi Milena,

    One doubt, there are multiple instances of CSITX on J784S4, are you sending the frames to correct CSITX instance, which is connected to serializer on the board? From the log, i see you are using CSITX_INSTANCE_ID_1, is this one connected on your board?

    From the OpenVX log, yes, CSITX seems transmitting the data at around 64fps. 

    [MCU2_0] 2642.511792 s: ==========================================================
    [MCU2_0] 2642.511846 s: Channel Num | Frame Queue Count | Frame De-queue Count | Frame Repeat Count |
    [MCU2_0] 2642.511884 s: 0| 21717| 21717| 0|

    Which SDK release are you using for validating this feature? Because if i recollect, older releases were not supporting CSITX Instance-1.. 

    Regarding frame size, it is base on the input image, ie object array that has been provided to the CSITX node, so is the input image from the object array of size 1920x1080? 

    Regards,

    Brijesh

  • Hi Brijesh,

    I would say we are connected to the CSITX1 instance. We are using following pins on TDA4 (AP28, AP29, AT28, AT29, AN26, AN27, AV27, AV28, AU29, AU30).

    CSITX Params set in the following manner:

        tivx_csitx_params_init(&app->csitx_param);
        app->csitx_param.numInst = 1;
        app->csitx_param.numCh = NUM_CHANNEL;
        app->csitx_param.instId[0] = 1;
        app->csitx_param.chVcNum[0] = 0;
        app->csitx_param.chInstMap[0] = 1;
        app->csitx_param.instCfg[0].laneBandSpeed = TIVX_CSITX_LANE_BAND_SPEED_1400_TO_1600_MBPS;
        app->csitx_param.instCfg[0].numDataLanes = 4;
    
        tivxVideoIOLoadKernels(app->context);
    
        app->csitx_config = vxCreateUserDataObject(app->context, "tivx_csitx_params_t", sizeof(tivx_csitx_params_t), &app->csitx_param);
        app->node = tivxCsitxNode(app->graph, app->csitx_config, app->csitx_image_arr);

    We are using PSDK Linux: 10.00.00.08 (Aug 19, 2024)  and PSDK RTOS: 10.00.00.05 (Aug 19, 2024) .

    This version  should support CSITX1?

    For the input image, we are creating it in the following manner and it is 1936x1100. See snippet:

    #define NUM_CHANNEL 1
    #define FRAME_WIDTH 1936
    #define FRAME_HEIGHT 1100
    #define FRAME_HEIGHT_META_BEFORE 0
    #define FRAME_HEIGHT_META_AFTER 4
    
        tivx_raw_image_create_params_t prm;
    
        prm.width = FRAME_WIDTH;
    
        prm.height = FRAME_HEIGHT - FRAME_HEIGHT_META_AFTER - FRAME_HEIGHT_META_BEFORE;
        prm.line_interleaved = 0;
        prm.num_exposures = 1;
        prm.meta_height_after = FRAME_HEIGHT_META_AFTER;
        prm.meta_height_before = FRAME_HEIGHT_META_BEFORE;
        prm.format->pixel_container = TIVX_RAW_IMAGE_16_BIT;
        prm.format->msb = 11;
            
        tivx_raw_image img =  tivxCreateRawImage(app->context, &prm);
        app->csitx_image_arr = vxCreateObjectArray(context, (vx_reference)img, NUM_CHANNEL);

    And this is further forwarded...

    Regards,

    Milena

  • Hi Milena,

    Well, looking at the issues, most of them related to CSITX instance 1 are fixed in SDK09.00, so yes, it should be supported in the SDK10.0.

    Let me see if there is anything else. 

    Regards,

    Brijesh

  • Can you please confirm that even CSITX1 you are using with 26MHz reference input clock? 

    Regards,

    Brijesh

  • HI Brijesh,

    Yes, we are using the ECU instance where we have 26Mhz reference input clock - the one with functional display.

    You can see this and some other params(lanespeed, fbdiv) in the full log that I attached in one of the previous replies.

    Additionally, I am suspecting that we do not generate clock (either at all or not at the expected line).

    Serializer has not raised basic PCLK detected flag (this is raised for any detected clock which is > 4Mhz .).

    Regards,

    Milena

  • Hello Milena,

    I think CSITX is configured in continuous clock mode, so even if there is no data, clock should have been detected. Looks like DPHY is not getting enabled. Can you put breakpoint on setDphyConfigModeLnEnable API and see if it is getting hit and it is enabling all clock and data lanes? and this one also CSITX_Start? 

    Regards,

    Brijesh

  • Hi Brijesh,

    We have added prints in the functions.

    We do have 2 calls of the setDphyConfigModeLnEnable .

    See params below (printed as %u):

    [MCU2_0]    276.714226 s: ENTRY (setDphyConfigModeLnEnable) : tmpValue 512
    [MCU2_0]    276.714272 s:  dphyLn0Enable 0 dphyLn1Enable 0 dphyLn2Enable 0 dphyLn3Enable 0 dphyClkEnable 0
    
    ....
    
    [MCU2_0]    276.714445 s: ENTRY (setDphyConfigModeLnEnable) : tmpValue 4608
    [MCU2_0]    276.714492 s:  dphyLn0Enable 1 dphyLn1Enable 1 dphyLn2Enable 1 dphyLn3Enable 1 dphyClkEnable 1

    There is no printout from the CSITX_Start, but also we could not find from where is this function called at all?

    We have dumped dphy registers before(CSITX1 group of registers) and during running of the usecase. Find below:

    ************************************************************* before use case
    root@j784s4-evm:~# devmem2 0x04414028
    /dev/mem opened.
    Memory mapped at address 0xffffbf32d000.
    Read at address  0x04414028 (0xffffbf32d028): 0x00000200
    root@j784s4-evm:~# devmem2 0x0441402C
    /dev/mem opened.
    Memory mapped at address 0xffff86017000.
    Read at address  0x0441402C (0xffff8601702c): 0x00004E20
    root@j784s4-evm:~# devmem2 0x04414030
    /dev/mem opened.
    Memory mapped at address 0xffff9e490000.
    Read at address  0x04414030 (0xffff9e490030): 0x00004E20
    root@j784s4-evm:~# devmem2 0x04414034
    /dev/mem opened.
    Memory mapped at address 0xffffbe558000.
    Read at address  0x04414034 (0xffffbe558034): 0x00000000
    root@j784s4-evm:~# devmem2 0x04414038
    /dev/mem opened.
    Memory mapped at address 0xffff9d95d000.
    Read at address  0x04414038 (0xffff9d95d038): 0x00001F00
    root@j784s4-evm:~# 
    root@j784s4-evm:~# 
    root@j784s4-evm:~# 
    ************************************************************* during use case
    root@j784s4-evm:~# devmem2 0x04414028
    /dev/mem opened.
    Memory mapped at address 0xffff86c98000.
    Read at address  0x04414028 (0xffff86c98028): 0x0000111F
    root@j784s4-evm:~# devmem2 0x0441402C
    /dev/mem opened.
    Memory mapped at address 0xffffa4270000.
    Read at address  0x0441402C (0xffffa427002c): 0x00005140
    root@j784s4-evm:~# devmem2 0x04414030
    /dev/mem opened.
    Memory mapped at address 0xffff81bf9000.
    Read at address  0x04414030 (0xffff81bf9030): 0x00005140
    root@j784s4-evm:~# devmem2 0x04414034
    /dev/mem opened.
    Memory mapped at address 0xffffa2418000.
    Read at address  0x04414034 (0xffffa2418034): 0x00000000
    root@j784s4-evm:~# devmem2 0x04414038
    /dev/mem opened.
    Memory mapped at address 0xffffa2899000.
    Read at address  0x04414038 (0xffffa2899038): 0x00001F0F
    root@j784s4-evm:~#

    Regards,

    Milena

  • Hi,

    Additionally, here are the registers of the DPHY_TX1

    root@j784s4-evm:~# devmem2 0x04481020
    /dev/mem opened.
    Memory mapped at address 0xffff95e63000.
    Read at address  0x04481020 (0xffff95e63020): 0x00000229
    root@j784s4-evm:~# devmem2 0x04481040
    /dev/mem opened.
    Memory mapped at address 0xffff84d29000.
    Read at address  0x04481040 (0xffff84d29040): 0x0087FC0E
    root@j784s4-evm:~# devmem2 0x0448104C
    /dev/mem opened.
    Memory mapped at address 0xffffb253e000.
    Read at address  0x0448104C (0xffffb253e04c): 0x00000000
    root@j784s4-evm:~# devmem2 0x04481050
    /dev/mem opened.
    Memory mapped at address 0xffffbf4ef000.
    Read at address  0x04481050 (0xffffbf4ef050): 0x00000000
    root@j784s4-evm:~# devmem2 0x04481154
    /dev/mem opened.
    Memory mapped at address 0xffff8bcb4000.
    Read at address  0x04481154 (0xffff8bcb4154): 0x00000000
    root@j784s4-evm:~# devmem2 0x0448126C
    /dev/mem opened.
    Memory mapped at address 0xffff9c6ce000.
    Read at address  0x0448126C (0xffff9c6ce26c): 0x00000000
    root@j784s4-evm:~# devmem2 0x0448136C
    /dev/mem opened.
    Memory mapped at address 0xffffa8f93000.
    Read at address  0x0448136C (0xffffa8f9336c): 0x00000000
    root@j784s4-evm:~# devmem2 0x0448146C
    /dev/mem opened.
    Memory mapped at address 0xffff8011c000.
    Read at address  0x0448146C (0xffff8011c46c): 0x00000000
    root@j784s4-evm:~# devmem2 0x0448156C
    /dev/mem opened.
    Memory mapped at address 0xffff9691b000.
    Read at address  0x0448156C (0xffff9691b56c): 0x00000000
    root@j784s4-evm:~# devmem2 0x04481B00
    /dev/mem opened.
    Memory mapped at address 0xffff7fc4a000.
    Read at address  0x04481B00 (0xffff7fc4ab00): 0x00000252
    root@j784s4-evm:~# devmem2 0x04481B04
    /dev/mem opened.
    Memory mapped at address 0xffffa11b7000.
    Read at address  0x04481B04 (0xffffa11b7b04): 0x00000000
    root@j784s4-evm:~# devmem2 0x04481F04
    /dev/mem opened.
    Memory mapped at address 0xffffbb4b2000.
    Read at address  0x04481F04 (0xffffbb4b2f04): 0x80E60102
    root@j784s4-evm:~# devmem2 0x04481F08
    /dev/mem opened.
    Memory mapped at address 0xffff8a700000.
    Read at address  0x04481F08 (0xffff8a700f08): 0x80000006
    root@j784s4-evm:~# devmem2 0x04481F0C
    /dev/mem opened.
    Memory mapped at address 0xffff83629000.
    Read at address  0x04481F0C (0xffff83629f0c): 0x80000000
    root@j784s4-evm:~# devmem2 0x04481F10
    /dev/mem opened.
    Memory mapped at address 0xffffb0c71000.
    Read at address  0x04481F10 (0xffffb0c71f10): 0x00000014
    root@j784s4-evm:~# devmem2 0x04481F14
    /dev/mem opened.
    Memory mapped at address 0xffff837ad000.
    Read at address  0x04481F14 (0xffff837adf14): 0x00000001
    root@j784s4-evm:~# devmem2 0x04481FF8
    /dev/mem opened.
    Memory mapped at address 0xffffa8b98000.
    Read at address  0x04481FF8 (0xffffa8b98ff8): 0x00000000
    root@j784s4-evm:~# devmem2 0x04481FFC
    /dev/mem opened.
    Memory mapped at address 0xffffa1b3a000.
    Read at address  0x04481FFC (0xffffa1b3affc): 0x00000000
    root@j784s4-evm:~#

    Regards,

    Milena

  • Hi Milena,

    the configuration looks to be correct. can you please check the changes from below links and see if any of them helps? 

    https://e2e.ti.com/search?q=CSITX1&category=forum&group=264

    Regards,

    Brijesh

  • Hello Brijesh,

    Will check in details and feedback. I think we already checked majority of those issues.

    We are trying to figure where exactly is the issue with the clock not detected.

    Are there any registers/variables where we can confirm from code, that the DPHY is generating Clock (any clock).

    I have found following in the forum: https://e2e.ti.com/support/processors-group/processors/f/processors-forum/1376525/tda4vh-q1-csitx-output-image-abnormally/5288032?tisearch=e2e-sitesearch&keymatch=CSITX_MOD_DPHY_TXBYTECLKHS_CLK#5288032 

    Not sure if this 0Mhz is expected or not, since it is not clear from the thread, other thing resolved the issue (and we already have proper code for this in version 10 of the SDK).

    Basically I have added following in the code (CsiTX_printLogs function):

    And this function is called in control function (csitx_drv.c )before the stop command (this should be still during running usecase):

    Values that we get are below: 

    Is this 0Mhz for the CSITX_MOD_DPHY_TXBYTECLKHS_CLK expected or not? 

    I have also not found that this is set somewhere from the code, from the csitx part.

    Regards,

    Milena

  • Hi Brijesh,

    It seems we have similar issue (if not same as in this comment: https://e2e.ti.com/support/processors-group/processors/f/processors-forum/1376525/tda4vh-q1-csitx-output-image-abnormally/5288032#5288032) .

    From the thread it is not visible how is this resolved.

    We have rebuilt pdk csitx_transmit_test for our custom board and result is same regarding CSITX_MOD_DPHY_TXBYTECLKHS_CLK (it is 0):

    CSITX inst 1
    ---------------------------------------------------
    Clock Freq: CSITX_MOD_ESC_CLK = 20000000Hz
    Clock Freq: CSITX_MOD_DPHY_TXBYTECLKHS_CLK = 0Hz
    Clock Freq: CSITX_MOD_VBUS_CLK = 250000000Hz
    Clock Freq: CSITX_MOD_MAIN_CLK = 500000000Hz
    CSITX_TX_APP: Sample Application - STARTS !!!
    CSITX_TX_APP: Tx DF:0x2c
    CSITX_TX_APP: Tx Resolution:1920 x 1080
    CSITX_CAPT_APP:Set D-PHY Configuration Successful!!!
    CSITX_CAPT_APP: CSIRX Capture created
    CSITX_TX_APP: CSIRX DRV created
    CSITX_TX_APP: CSITX DRV created

    During the use case running and vision-apps:

    we did some measurements via scope, with our HW .. (note that our scope goes to 500Mhz).. cannot actually see properly data/clock, but changes can be observed..

    We have decreased lane-speed to 100Mb, in order to more easily detects changes..

    • On the data line, it seems that we are in the CSI link probing/training phase 
    • For the clock line, when we do not enable clock, there is some noise, when we enable clock (run app), there is same noise but just offsett-ed to above (middle value is higher).

    Below is image of the data line from scope:

    Any idea why we do have this behavior?

    Best regards,

    Milena

  • Hi Brijesh,

    We have also run same example on j784s4_evm board (CSITX1 instance), and TXBYTECLKHS clock is also 0Mhz? Is this expected?

    Clock Freq: CSITX_MOD_ESC_CLK = 20000000Hz
    Clock Freq: CSITX_MOD_DPHY_TXBYTECLKHS_CLK = 0Hz
    Clock Freq: CSITX_MOD_VBUS_CLK = 250000000Hz
    Clock Freq: CSITX_MOD_MAIN_CLK = 500000000Hz
    CSITX_TX_APP: Sample Application - STARTS !!!
    CSITX_TX_APP: Tx DF:0x2c
    CSITX_TX_APP: Tx Resolution:1920 x 1080
    CSITX_CAPT_APP:Set D-PHY Configuration Successful!!!
    CSITX_CAPT_APP: CSIRX Capture created
    CSITX_TX_APP: CSIRX DRV created
    CSITX_TX_APP: CSITX DRV created
    

    Regards,

    Milena

  • Hello Milena,

    But there cann't be any data without clock. CSI cannot output data without clock.. So if you are seeing data, there must be clock also at the output lane. 

    Also i am not sure why TXBYTECLK is set to 0, i need to check what is the source for this output and need to see from that point. 

    But we do have other customers who were able to get CSITX1 running from the above e2e thread. 

    Regards,

    Brijesh 

  • Hi Brijesh,

    Would like to check with you meaning of the STOP STATE bits in the register:

    I am interpreting this as clock lane not in stop state, while data lanes in stop state?

    root@j784s4-evm:~# devmem2 0x04414038
    /dev/mem opened.
    Memory mapped at address 0xffffa2899000.
    Read at address  0x04414038 (0xffffa2899038): 0x00001F0F

    Best regards,

    Milena

  • Hello Milena,

    Does this status value change on multiple reads? 

    Regards,

    Brijesh 

  • Hi Brijesh,

    Indeed it changes, register values alternates between  0x00001F0F and 0x00001F00 .

    Is this the indicator of the actual CSI2 active data transmition (flag not stopped) and blank period (flag stopped)?

    Regards,

    Milena

  • Hi Milena,

    Yes, the state is changing in the DPHY, which means it seems it is transmitting the data and that's why we are seeing the frames being rotated in the graph.. 

    Regards,

    Brijesh 

  • Hi Brijesh,

    We have also discussed with the serializer vendor, in order to determine what is not OK.

    Basically they raise flag for PCLK detected if certain conditions are met :

    • Configuration params check - all of the relevant configuration params are same on TDA4 and serializer (lanes polarity, num of lanes, etc..) , we double checked, and this should not be issue.
    • valid MIPI data is being sent to serializer. We suspect this one.

    Regarding the MIPI data and general remained opened and unclear, and can affect MIPI data:

    • TXBYTECLK is set to 0? have you managed to check this on your side? Is this non-expected behavior or this can be 0 and we can ignore it?
      • We have checked on our side and CMN0_O_ANA_PLL_BYTECLK_DIV(Byteclk divider value) has value 8 (register 0448 1040h).
      • How to enable TXBYTECLK ?
    • Data line recorded by the scope does not look like normal one. It has similar issue as not same is in above mentioned related thread.
      • From the thread solution is not visible, except the address fix in the memory adress in video_io kernel (which is already proper and included in version 10 of SDK).
      • Additionally we went through the comments, and double checked data which are mentioned, they all seem proper:
      • We are using RAW12 image in tiovx:
      •     prm.width = FRAME_WIDTH;
            prm.height = FRAME_HEIGHT - FRAME_HEIGHT_META_AFTER - FRAME_HEIGHT_META_BEFORE;
            prm.line_interleaved = 0;
            prm.num_exposures = 1;
            prm.meta_height_after = FRAME_HEIGHT_META_AFTER;
            prm.meta_height_before = FRAME_HEIGHT_META_BEFORE;
            prm.format->pixel_container = TIVX_RAW_IMAGE_16_BIT;
            prm.format->msb = 11;
      • register (0x04414080) value for DT is 0x000001B2
      • Do you know how is this being resolved in the related thread?

    Best regards,

    Milena

  • Hi Brijesh,

    Not sure if this can influence current behavior, but we noticed following.

    OnTDA4 vBlank and hBlank are set as:

    prms->instCfg[loopCnt].vBlank = 22U;  /*!< Vertical blanking in terms of number of line. */
    prms->instCfg[loopCnt].hBlank = 40U;  /*!< Horizontal blanking in terms of number of pixels */

    We do have some requirements from the SER side regarding following:

    • minumum horizontal blanking in terms of pixels. - > 40  is OK
    • minimal vertical blanking in terms of  number of lines -> 22 is OK here
    • minimum vertical front porch  in terms of  number of lines -> how to find this value on TDA4?
    • vertical back porch  in terms of  number of lines -> how to find this value on TDA4?

    Milena

  • Hi Milena,

    I really doubt that these parameters are used in the CSITX and getting configured in the register, i will check. Apart from this, Need to see why Byte Clock is 0. Is it possible to quickly try CSITX0 and see if it also reports Byte clock as 0? Most likely it shouldn't be.

    Regards,

    Brijesh

  • Hi Brijesh,

    I have changed the instance in the create params, and adapted defines for reading the clocks of CSITX0..

    And tested like that.

    app->csitx_param.instId[0] = 0;//1;
    app->csitx_param.chVcNum[0] = 0;
    app->csitx_param.chInstMap[0] = 0;//1;
    
    ------------------------------------------------
    
    #define CSITX_MOD                               TISCI_DEV_CSI_TX_IF0
    #define CSITX_DPHY_MOD                          TISCI_DEV_DPHY_TX0
    #define CSITX_MOD_ESC_CLK                       TISCI_DEV_CSI_TX_IF0_ESC_CLK_CLK
    #define CSITX_MOD_MAIN_CLK                      TISCI_DEV_CSI_TX_IF0_MAIN_CLK_CLK
    #define CSITX_MOD_DPHY_TXBYTECLKHS_CLK          TISCI_DEV_CSI_TX_IF0_DPHY_TXBYTECLKHS_CL_CLK
    #define CSITX_MOD_VBUS_CLK                      TISCI_DEV_CSI_TX_IF0_VBUS_CLK_CLK

    Please have in mind that we have DSI and Display on DPHY0.. Not sure if this is completely valid.

    It reads the same values:

    
    GRAPH:         graph_70 (#nodes =   1, #executions =    620)
     NODE:          CSITX:                  node_78: avg =   5278 usecs, min/max =   5158 /   6833 usecs, #executions =        620
    
     PERF:            TOTAL: avg =  16963 usecs, min/max =  16963 /  16963 usecs, #executions =          1
    
     PERF:            TOTAL:   58.95 FPS
    
        76.426120 s:  VX_ZONE_INIT:[tivxHostDeInitLocal:120] De-Initialization Done for HOST !!!
    [MCU2_0]     76.419913 s:
    [MCU2_0]     76.420004 s: Clock Freq (retVal 0): CSITX_MOD_ESC_CLK = 20000000Hz
    [MCU2_0]     76.420073 s: Clock Freq (retVal 0): CSITX_MOD_DPHY_TXBYTECLKHS_CLK = 0Hz
    [MCU2_0]     76.420136 s: Clock Freq (retVal 0): CSITX_MOD_VBUS_CLK = 250000000Hz
    [MCU2_0]     76.420172 s: Clock Freq (retVal 0): CSITX_MOD_MAIN_CLK = 500000000Hz
    [MCU2_0]     76.420202 s:
    [MCU2_0] =====================================================
    [MCU2_0]     76.420228 s: ::Debug Logs::
    [MCU2_0]     76.420245 s:
    [MCU2_0] =====================================================
    [MCU2_0]     76.420282 s: [LOG]Frame: 0 | Inst: 0 | Ch ID: 0x0 | FRM TYPE: 1 | FRM Status: 0x1 | TR Resp: 0x0 | TS: 0 |
    [MCU2_0]     76.420324 s: [LOG]Frame: 1 | Inst: 0 | Ch ID: 0x0 | FRM TYPE: 1 | FRM Status: 0x1 | TR Resp: 0x0 | TS: 0 |
    [MCU2_0]     76.420365 s: [LOG]Frame: 2 | Inst: 0 | Ch ID: 0x0 | FRM TYPE: 1 | FRM Status: 0x1 | TR Resp: 0x0 | TS: 0 |
    .......
    .......
    [MCU2_0]     76.424633 s: ==========================================================
    [MCU2_0]     76.424667 s:  Csitx Status: Instance|0
    [MCU2_0]     76.424686 s: ==========================================================
    [MCU2_0]     76.424717 s:  FIFO Overflow Count: 0
    [MCU2_0]     76.424736 s:   Channel Num | Frame Queue Count | Frame De-queue Count | Frame Repeat Count |
    [MCU2_0]     76.424773 s:               0|              620|            620|            0|
        76.430526 s:  VX_ZONE_INIT:[tivxDeInitLocal:206] De-Initialization Done !!!
    APP: Deinit ... !!!


    Regards,

    Milena

  • Hi Milena,

    but here also TXBYTECLKHS is set to 0, so maynot be related to this issue. Most likely, something else is not allowing CSITX1 output. 

    Regards,

    Brijesh

  • Hi Brijesh it is 0 here as well.

    As I mentioned, we have also run same PDK  example (csitx_transmit_test) on j784s4_evm board (CSITX1 instance), and TXBYTECLKHS clock is also 0Mhz, as well. We have only baseboard for the EVM.

    Clock Freq: CSITX_MOD_ESC_CLK = 20000000Hz
    Clock Freq: CSITX_MOD_DPHY_TXBYTECLKHS_CLK = 0Hz
    Clock Freq: CSITX_MOD_VBUS_CLK = 250000000Hz
    Clock Freq: CSITX_MOD_MAIN_CLK = 500000000Hz
    CSITX_TX_APP: Sample Application - STARTS !!!
    CSITX_TX_APP: Tx DF:0x2c
    CSITX_TX_APP: Tx Resolution:1920 x 1080
    CSITX_CAPT_APP:Set D-PHY Configuration Successful!!!
    CSITX_CAPT_APP: CSIRX Capture created
    CSITX_TX_APP: CSIRX DRV created
    CSITX_TX_APP: CSITX DRV created

    Do you have any ideas what else can we check, how to debug further? We are out of ideas.

    My understanding is that this clock is set/generated once we enter the HS transmition. Correct?

    And checking the scope log, it seems we have not reached HS data transfer.

    Milena

  • Hi Brijesh,

    We have performed additional several tests with different serializer modes, in order to see what serializer detects.

    In summary:

    • Serializers detected clock lane.
    • Serializers perceives data lanes /data as not proper.

    We are suspecting on some configuration mismatch. Do you have suggestions what  all can be checked/confirmed  in order to reach HS transmition? 

    Regards,

    Milena

  • Hello Milena,

    If the clock lane is detected and data is incorrect, is there any interference on the board?  

    Regards,

    Brijesh

  • Hi Brijesh,

    We have confirmed that serializer is receiving valid MIPI data on protocol level, but the video data seems as not valid (blank frames, or HS/VS configuration mismatch, etc.).

    Based on the registers on the TDA4 side or something else, is there a way to check/assume what is wrong with the data?

    How we can enable debug registers of the CSITX?

    • Checking the registers xls - debug_cfg (0441 4D00h) should be set to 1.
    • "Debug Enable. This bit enables debug when high. If low then other DEBUG registers read 0."
    • When we set this register to 1  using devmem2 - rest of the debug registers remain with value 0.

    Best regards,

    Milena

  • Hi Milena,

    But HS/VS indicators are part of the protocols, isn't it? There should be a short frame packet, which indicates HS or VS signals. Are you able to receive these signals/packets?

    Regards,

    Brijesh

  • Hi Brijesh,

    Indeed.

    We do not have direct insight in serializer.

    Feedback that we got from serializer vendor is that certain counters are toggling (for PHY, CSI), which means that the MIPI data is received and processed.

    They recommend us checking the SoC side if the video is generated. 

    Regards,

    Milena

  • Hi Brijesh,

    We discussed with the serialzier vendor in order to try to conclude what might be wrong.

    Their understanding is that SoC is generating valid MIPI data on the protocol level so the serializer is receiving valid MIPI data. But, the video data is an invalid… Serializer cannot recognize what type, but wrong H and/or V signals may cause this problem. They  suggest  to check the frame sync signals

    Additionally, they stated it could be likely due that we don’t meet H and/or V specs. Have you managed to check how we can see/influence these two values (VFP/VBP)?

    OnTDA4 vBlank and hBlank are set as:

    Fullscreen
    1
    2
    prms->instCfg[loopCnt].vBlank = 22U; /*!< Vertical blanking in terms of number of line. */
    prms->instCfg[loopCnt].hBlank = 40U; /*!< Horizontal blanking in terms of number of pixels */
    XXXXXXXXXXXXXXXXXXXXXXXXXXXXXXXXXXXXXXXXXXXXXXXXXX

    We do have some requirements from the SER side regarding following:

    • minumum horizontal blanking in terms of pixels. - > 40  is OK
    • minimal vertical blanking in terms of  number of lines -> 22 is OK here
    • minimum vertical front porch  in terms of  number of lines -> how to find this value on TDA4?
    • vertical back porch  in terms of  number of lines -> how to find this value on TDA4?

    Regards,

    Milena