This thread has been locked.

If you have a related question, please click the "Ask a related question" button in the top right corner. The newly created question will be automatically linked to this question.

CCS/TIDEP-01017: Boot TDA2 via CCS and Step through Code

Part Number: TIDEP-01017
Other Parts Discussed in Thread: TDA2,

Tool/software: Code Composer Studio

Hi,

I am trying to boot up TIDEP-01017 TDA2 via CCS and am following the steps provided in the Application Report SPRAC17B. I set the boot mode on SW4 to 6'b000000 as per the Technical Reference Manual SPRUI29F

The tda2xx_cascade_bios_radar build that is provided in the processor sdk package does not use A15 has the host processor, so I bypassed it in the ccxml launch file. When I try to connect Cortex_M4_IPU1_C0, I get an error as below:

Error connecting to the target:
(Error -1170 @ 0x0)
Unable to access the DAP. Reset the device, and retry the operation. If error persists, confirm configuration, power-cycle the board, and/or try more reliable JTAG settings (e.g. lower TCLK).

However, when I add back A15 as the host processor and connect to it first, then enable all cores from Scripts > TDA2xx_MULTICORE_Initialization > TDA2xx_MULTICORE_EnableAllCores and then connect to Cortex_M4_IPU1_C0, it is able to connect.

I subsequently connect to all the remaining processors and load corresponding binaries. However, since A15 binary was not compiled, I do not load it. Is this ok?

Also, once this is done I hit Resume on each of the processors and I see the below prints on the console:

[Cortex_M4_IPU1_C1]
MAC Port 0 Address:
    b4-52-a9-63-38-7a

MAC Port 1 Address:
    b4-52-a9-63-38-7b
Network Added: If-1:192.168.1.200
Service Status: Telnet   : Enabled  :          : 000
[Cortex_M4_IPU1_C0]  IPU1-0 Remote Log Shared Memory @ 0xbfb200a0
 IPU1-1 Remote Log Shared Memory @ 0xbfb2e8a0
 HOST Remote Log Shared Memory @ 0xbfb310a0
 DSP1 Remote Log Shared Memory @ 0xbfb360a0
 DSP2 Remote Log Shared Memory @ 0xbfb388a0
 EVE1 Remote Log Shared Memory @ 0xbfb3b0a0
 EVE2 Remote Log Shared Memory @ 0xbfb3d8a0
 EVE3 Remote Log Shared Memory @ 0xbfb400a0
 EVE4 Remote Log Shared Memory @ 0xbfb428a0
 IPU2 Remote Log Shared Memory @ 0xbfb450a0

However, I still do not see the TDA2 boot up via UART terminal. Is there any step I am missing? How do I step through the code once boot up is done?

Thanks,

Siddharth

  • Hello, 

    Siddharth Advani said:
    I subsequently connect to all the remaining processors and load corresponding binaries. However, since A15 binary was not compiled, I do not load it. Is this ok?

    Yes, it should be fine. The initialization scripts are ran on A15, that's why it's needs to connect there first and initialize the main processor. After which, you can do a IPUClkEnable_API if you are power conservative instead of initializing all cores. I was able to manage this, see screenshot:

    Siddharth Advani said:
    However, I still do not see the TDA2 boot up via UART terminal.

    I am not sure since I do not use/print on UART, have you tried enabling the UART module first from the same menu where the scripts are located (that is, PRCM_Module_AllEnable_Config)?

    Siddharth Advani said:
    How do I step through the code once boot up is done?

    I don't have the SDK project set up currently, but as far as I know, if you set breakpoints this should enable the breaking while at debug session, then in the code view you should be able to step through/into/over. 

    Hope it helps, 

    thanks,

    Alex

  • Hi Alex,

    Thanks for your response. My app requires Cortex_M4_IPU1_C0, Cortex_M4_IPU1_C1, C66xx_DSP1, ARP32_EVE_1, ARP32_EVE_2, ARP32_EVE_3 and ARP32_EVE_4 so I enable them while bypassing the remaining (accept Cortex_A15_0). 

    Once all the binaries are loaded and the cores are running, I did step through the code and I find that the IPU is in idle mode, in pmlib_cpuidle_utils_m4.asm probably waiting for user event  (via UART)

    PmlibDoWFI:
    stmfd sp!, {lr}

    ; /*
    ; * Execute an ISB instruction to ensure that all of the
    ; * CP15 register changes have been committed.
    ; */
    isb

    ; /*
    ; * Execute a barrier instruction to ensure that all cache,
    ; * TLB and branch predictor maintenance operations issued
    ; * by any CPU in the cluster have completed.
    ; */
    dsb
    dmb

    ; /*
    ; * Execute a WFI instruction and wait until there is a wakeup event
    ; */
    wfi ;@ Wait For Event
    nop
    nop
    nop
    nop
    nop
    nop
    nop
    nop
    nop
    nop
    nop
    nop
    nop
    nop
    nop
    nop

    ldmfd sp!, {pc}

    As per your suggestion, I tried to run PRCM_Module_AllEnable_Config to enable the UART, but that did not help. I notice that you are using Blackhawk USB560 as your debug tool. I am using XDS200 with a MIPI60 adaptor connected to the TDA2. Hope that does not matter too much (apart from data transfer bandwidth). Appreciate if you could help me get the UART online to see the TDA2 bootup sequence via CCS.

    Thanks,

    Siddharth

  • Let us ask the SDK team since I am not aware really what can be wrong. They will reply here soon. The good thing is that you are now able to connect. 

    thanks,

    Alex

  • Hi Siddharth

    In the GEL files are you making sure you are setting the below to 1:

    GEL File: TDA2xx_multicore_reset.gel

    #define VISION_SDK_CONFIG      0 --> 1

    The behavior you are seeing is typically when the IPC Sync between all the cores is stuck. This happens when any one of the cores has crashed or is not loaded or the MMU settings are not correct for the IPC to work correctly.

    Thanks and Regards

    Piyali

  • Hi Piyali,

    I set VISION_SDK_CONFIG  to 1, but that did not help the TDA2 to boot-up. 

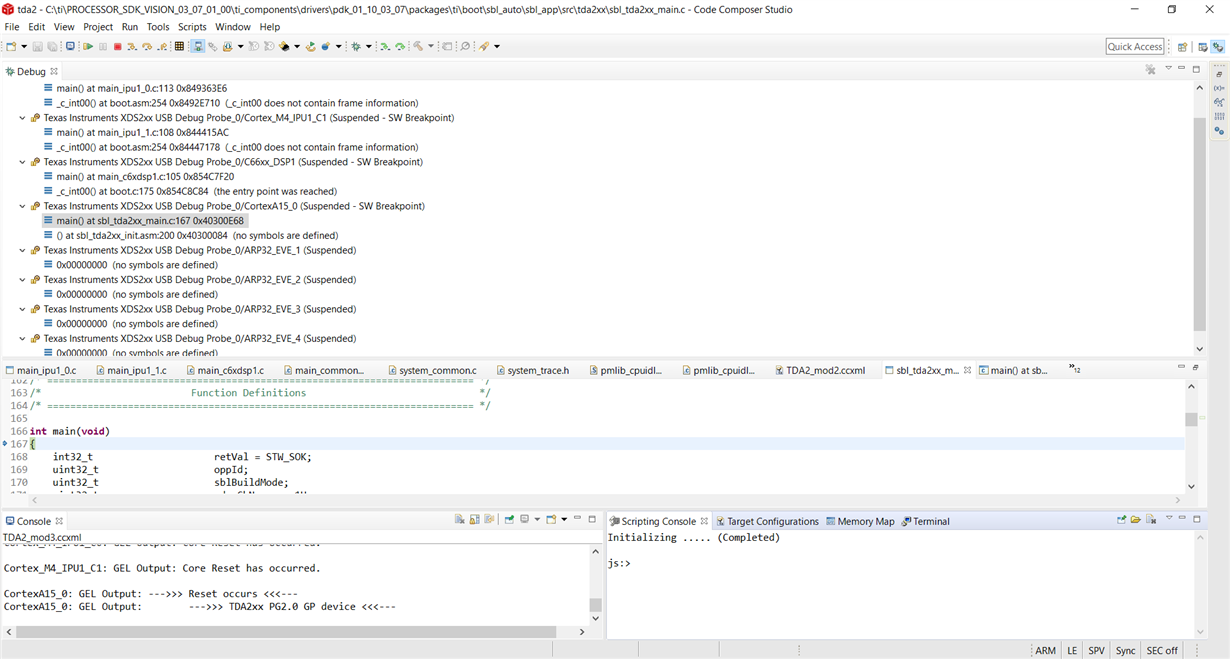
    I noticed that after compilation, a .xa15g gets created in the same folder as the MLO file. I loaded that for the A15 processor in CCS and now I am able to step through sbl_td2xx_main.c until the TDA2 boots up.

    However I am facing two issues:

    (i) The bootup occurs only if the SD card with the AppImage is inserted into the TDA2. 

    (ii) If I set breakpoints in parts of the code subsequent to the boot-up, for example in chains_radar_main.c, the control does not return to CCS

    I am not sure how to proceed since the main goal of using CCS was to be able to step through relevant parts of the radar processing pipeline. Any suggestions?

    Thanks,

    Siddharth

  • Siddharth

    You are mixing 2 flows:

    Flow 1:

    Load SBL on A15 and keep the application image in an SD card and then run the SBL via CCS. 

    If your intention is to use SBL to load the images, you need not load the SBL through CCS. You could load the MLO and the Appimage in the SD card, boot from the SD card (You would need to set the right SYSBOOT pins on the board for the SD card to boot) and then once the system is booted, you can connect to the CCS core you wish to debug and then load only the symbols from the .xem4, or .xe66. 

    You would be able to set the breakpoints only when you have the symbols loaded.

    Also note, if you are going the SBL routed please do not load the other executables via CCS. Also, make sure you do not run GEL files as this would re-initialize the system from what the SBL has already initialized.  GELs should not be run before running SBL as well in a single power cycle.

    Flow 2:


    Load the executables via CCS directly. Here you would need to make sure you load all the executables corresponding to the CFG file. The default for cascade radar bios configuration is as below:

    PROC_IPU1_0_INCLUDE=yes
    PROC_IPU1_1_INCLUDE=yes
    PROC_IPU2_INCLUDE=no
    PROC_A15_0_INCLUDE=no
    PROC_DSP1_INCLUDE=yes
    PROC_DSP2_INCLUDE=no
    PROC_EVE1_INCLUDE=yes
    PROC_EVE2_INCLUDE=yes
    PROC_EVE3_INCLUDE=yes
    PROC_EVE4_INCLUDE=yes

    I see in your snapshot EVE cores are at 0x0. They should be at main if loaded correctly.

    Once you see all the cores with yes marked for them, is loaded and reached main, you would need to run the cores. You can leave the A15 connected. Note the counter32K has a debug dependency on the A15 CCS halt state, in order to get the correct time stamps, you would eventually need to keep the A15 running.

    The IPC between all the cores should complete for you to see the UART logs in the console. Even if one core is stuck or not run correctly the IPC Sync between all cores would not go through and the UART initialization code would not be reached on the IPU.

    Thanks and Regards

    Piyali

  • Thanks for the clarification Piyali. We decided to focus on Flow #2 and realized that when debugging on Windows 10 platform, the EVE processors would start running immediately after loading the binary rather than breaking at main. We moved to a Linux setup, connected to the A15 (without loading any binary for it), loaded all the binaries and the TDA2 boots up as expected. We are also able to place breakpoints after bootup and are able to use the debug environment. Thanks for the assistance.