This thread has been locked.

If you have a related question, please click the "Ask a related question" button in the top right corner. The newly created question will be automatically linked to this question.

TDA3: 16 samples FFT support

Part Number: TDA3

Hi,

We are trying to reduce the overall framePrediodicity (frame rate) of a chirp configuration. From looking at the below equation which I found from one of the existing support thread.

(rampEndTime*10 + idleTimeConst*10)*(chirpEndIdx-chirpStartIdx+1)*loopCount < framePeriodicty, I would like to keep the rest of the parameters the same other than the loopCounter. we tried to reduce the loopCount which is currently set to 128 in our usecase. This loopCounter actually correspond to number of chirps in a frame. We would like to use 16 chirps to reduce to frame time by a factor of 8. However, the current vision sdk does NOT currently support such a small number of FFT samples.

How hard is it to add support for 16 and 32 sample FFT?

Thanks,

--Khai

  • Hi Khai,
    We haven't done a full analysis for such small resolution but initial thought is that with current approach we may not be able to utilize the full SIMD width of VCOP. We might have to come up with a new approach to efficiently implement such small sample size.

    Regards,
    Anshu
  • HI Anshu,

    I understand vision sdk currently doesn't have support for this small FFT sample size. We would like to ask for your support on implementing it. It's very important that this sample size be supported in vision sdk to achieve our beam steering timing for POC objective with our partners and customers. If you think we need to go through TI upper management to request this to be implemented, we will do so. If it's a relatively easy addition, please consider advicing us on how it can be done?

    Thanks,

    --Khai

  • Khai,

       Currently we don't have any plan for supporting  smaller dimension FFT's. 


    Regards,

    Anshu

  • I am still trying to understand what is framePeriodicity parameter in the chirp config is telling me. I am trying to figure out the time required for an overall processing (Range/Doppler FFT + CFAR) and Ethernet out for one chirp frame. Below is my understanding or guess what it means. Please correct me if I am off based on my understanding.

    - framePeriodicity specifies the duration in time of the chirp frame. This chirp frame duration does NOT include the algorithm and Ethernet download time. For example, our framePeriodicity is set to (rampEndTime + idleTimeConst)*(chirpEndIdx-chirpStartIdx+1)*loopCount = 4.2 ms where rampEndTime = 30.87us, idleTimeConst = 2us, chirpStartIdx = 0, chirpEndIdx = 0 , loopCount = 128
    - The framePeriodicity calculation above had a factor of 10x to this equation (rampEndTime*10 + idleTimeConst*10)*(chirpEndIdx-chirpStartIdx+1)*loopCount < framePeriodicty. What's that 10x factor for? Is it taking into account for algorithm and Ethernet output?
    - framePeriodicity seems to also governs the Ethernet output frame rate. If I specified it large enough such as 42 ms, this is the frame rate I actually receive my RDM and CFAR data on the Host PC over Ethernet. It also seems to work when I set it to 20 ms. But if I set it to 10 ms, I begin to get inconsistent data rate (fluctuating wildly between the framePeriodicity rate) when the RDM and CFAR are delivered to the Host PC.

    Thanks,
    --Khai
  • Khai,

    framePeriodicity is an AWR1243 parameter which is used to determine the overall usecase FPS.

    This does not include the algorithm and ethernet time.

    The following diagram is a representative (not to scale) image for the relative timing for the different stages.

    The 10x value in the formula is to convert the timing to the same time base. rampEndTime and idleTimeConst are in 10s of nanoseconds. framePeriodicity, as given in the AWR1243 frameConfig parameter, is in steps of 5 ns. As long as you are maintaining the same time base (ms or us or ns) on both sides of the formula, it is fine.

    When you reduce the frame time, the Ethernet data rate rises. Based on the data rate you need to make sure you provide enough time as per framePeriodicity for the CSI data transfer from AWR to TDA and also TDA to PC.

    Supported Ethernet data rates are mentioned in the PROCESSOR_SDK_RADAR_\ti_components\networking\nsp_gmacsw_docs\nsp_vayu_datasheet.pdf

    Regards,

    Piyali

  • Hi Piyali,

    Thanks for the answers. If I understand you correctly and the processing timeline shown in the picture, framePeriodicity defines the frame period for one chirp sequence only and not include Algorithm and Ethernet download time. 

    However, Algorithm and Ethernet time can happen in parallel while the next chirp sequence is ADCed and collected in CSI buffer. So as long as Algorithm and Ethernet download finishes within the framePeriodicity, we will be OK.

    In the past we set framePeriodicity to 66ms. We actually see Ethernet throughput at 15 frames/sec. However, for the chirp config parameters we are using (4.3ms), framePeriodicity can come down to 5ms for 128 chirps loop count. I must make sure that Algorithm and Ethernet download time finishes before 5ms and I will be OK.

    Is that how it works? You mentioned "When you reduce the frame time, the Ethernet data rate rises". Not sure what that means. I did a little calculation of the time required to output data over TFDTP at 500Mbps setting. The RDM + MetaData + CFAR data structures is 570,000 bytes or 4.56Mbits. That means it requires about 10ms to output that chunk of data. Now I also timed the Algorithm processing time required and is about 6.7ms processing from the time a new frame of data coming in to the IssCapture Link to completing CFAR before network output.

    With what I have laid out, does that mean framePeriodicity can be set to 17ms (6.7ms + 10ms) and the data will flow without any problem?

    Thanks,

    --Khai

  • If I understand you correctly and the processing timeline shown in the picture, framePeriodicity defines the frame period for one chirp sequence only and not include Algorithm and Ethernet download time.

    [Piyali]: Yes.

    However, Algorithm and Ethernet time can happen in parallel while the next chirp sequence is ADCed and collected in CSI buffer. So as long as Algorithm and Ethernet download finishes within the framePeriodicity, we will be OK.

    [Piyali]: There is a pipeline, so the Algorithm time can go up to frame periodicity, Ethernet time can individually go up to framePeriodicity to stretch the system.

    In the past we set framePeriodicity to 66ms. We actually see Ethernet throughput at 15 frames/sec. However, for the chirp config parameters we are using (4.3ms), framePeriodicity can come down to 5ms for 128 chirps loop count. I must make sure that Algorithm and Ethernet download time finishes before 5ms and I will be OK.

    [Piyali]: If you keep both times below 5 ms, you would be okay.

    Is that how it works? You mentioned "When you reduce the frame time, the Ethernet data rate rises". Not sure what that means. I did a little calculation of the time required to output data over TFDTP at 500Mbps setting. The RDM + MetaData + CFAR data structures is 570,000 bytes or 4.56Mbits. That means it requires about 10ms to output that chunk of data. Now I also timed the Algorithm processing time required and is about 6.7ms processing from the time a new frame of data coming in to the IssCapture Link to completing CFAR before network output.

    [Piyali]: The data rate is determined by the frame Rate (given by the framePeriodicity) and the size you are transfering. As long as the Mbps is lower than the maximum the TFDTP can support, you are good.

    With what I have laid out, does that mean framePeriodicity can be set to 17ms (6.7ms + 10ms) and the data will flow without any problem?

    [Piyali]: Yes, you should be okay. Please look at the statistics log from the console to see if the FPS rate is being met by all the links and the CPU load is limited as per your uscecase expectation and requirements.
  • Hi Piyali,

    Thanks for the confirmation of my understanding again.

    I set framePeriodicity to 17ms (assuming 7 ms Alg + 10 ms Ethernet) for the 128 chirp frame and it seems to keep up without any links exhibited drops. This is with the PC requesting the RDM + Metadata + CFAR list streaming to Host PC. I then went ahead and changed the framePeriodicity to 12ms thinking that if I just want to see at least Algorithm processing can keep up without network streaming request. It turned out all the links are fine until FFT. FFT exhibited 23 FPS drops from 83 FPS to like 60 FPS. From then onward, the rest of the link below it had the same drops. Why is that the case?

    I then tried 12 ms with 64 chirps frame. That works with no drops with or without network streaming request. The number doesn't seem to add up based on my understanding of the data flow diagram you provided.

    Thanks,

    --Khai

  • Khai,

    What is the local link latency you observe on the FFT algorithm?

    Thanks and Regards,
    Piyali
  • [IPU1-0] 70.819618 s:
    [IPU1-0] 70.819679 s: Output Statistics,
    [IPU1-0] 70.819740 s:
    [IPU1-0] 70.819770 s: CH | Out | Out | Out Drop | Out User Drop
    [IPU1-0] 70.819831 s: | ID | FPS | FPS | FPS
    [IPU1-0] 70.819923 s: ---------------------------------------------
    [IPU1-0] 70.820014 s: 0 | 0 72.48 0. 0 0. 0
    [IPU1-0] 70.820106 s:
    [IPU1-0] 70.820167 s: [ IPC_IN_0 ] LATENCY,
    [IPU1-0] 70.820228 s: ********************
    [IPU1-0] 70.820289 s: Local Link Latency : Avg = 8 us, Min = 0 us, Max = 31 us,
    [IPU1-0] 70.820380 s: Source to Link Latency : Avg = 4193 us, Min = 183 us, Max = 60056 us,
    [IPU1-0] 70.820502 s:
    [IPU1-0] 70.820624 s:
    [IPU1-0] 70.820685 s: ### CPU [ DSP1], LinkID [ 49],
    [IPU1-0] 70.821173 s:
    [IPU1-0] 70.821265 s: [ ti.radar.fft ] Link Statistics,
    [IPU1-0] 70.821356 s: ******************************
    [IPU1-0] 70.821448 s:
    [IPU1-0] 70.821478 s: Elapsed time = 8337 msec
    [IPU1-0] 70.821539 s:
    [IPU1-0] 70.821661 s: New data Recv = 72.32 fps
    [IPU1-0] 70.821753 s:
    [IPU1-0] 70.821814 s: Input Statistics,
    [IPU1-0] 70.821875 s:
    [IPU1-0] 70.821905 s: CH | In Recv | In Drop | In User Drop | In Process
    [IPU1-0] 70.821997 s: | FPS | FPS | FPS | FPS
    [IPU1-0] 70.822088 s: --------------------------------------------------
    [IPU1-0] 70.822180 s: 0 | 72.44 12.83 0. 0 59.61
    [IPU1-0] 70.822302 s:
    [IPU1-0] 70.822363 s: Output Statistics,
    [IPU1-0] 70.822424 s:
    [IPU1-0] 70.822454 s: CH | Out | Out | Out Drop | Out User Drop
    [IPU1-0] 70.822546 s: | ID | FPS | FPS | FPS
    [IPU1-0] 70.822668 s: ---------------------------------------------
    [IPU1-0] 70.822759 s: 0 | 0 59.61 12.83 0. 0
    [IPU1-0] 70.822881 s:
    [IPU1-0] 70.822912 s: [ ti.radar.fft ] LATENCY,
    [IPU1-0] 70.823003 s: ********************
    [IPU1-0] 70.823064 s: Local Link Latency : Avg = 2360 us, Min = 2318 us, Max = 2470 us,
    [IPU1-0] 70.823186 s: Source to Link Latency : Avg = 7401 us, Min = 2562 us, Max = 62618 us,
    [IPU1-0] 70.823461 s:
    [IPU1-0] 70.823552 s: CPU [ DSP1], LinkID [ 25], Link Statistics not available !
    [IPU1-0] 70.823949 s:
    [IPU1-0] 70.824101 s: ### CPU [ DSP1], LinkID [ 51],
    [IPU1-0] 70.824162 s:
    [IPU1-0] 70.824223 s: [ ti.radar.drawfftheatmap ] Link Statistics,
    [IPU1-0] 70.824284 s: ******************************
    [IPU1-0] 70.824345 s:
    [IPU1-0] 70.824406 s: Elapsed time = 8336 msec
    [IPU1-0] 70.824467 s:
    [IPU1-0] 70.824498 s: New data Recv = 59.62 fps
    [IPU1-0] 70.824650 s:
    [IPU1-0] 70.824711 s: Input Statistics,
    [IPU1-0] 70.824803 s:
    [IPU1-0] 70.825474 s: CH | In Recv | In Drop | In User Drop | In Process
    [IPU1-0] 70.825718 s: | FPS | FPS | FPS | FPS
    [IPU1-0] 70.825840 s: --------------------------------------------------
    [IPU1-0] 70.825962 s: 0 | 59.62 2.51 0. 0 57.10
    [IPU1-0] 70.826145 s:
    [IPU1-0] 70.826206 s: Output Statistics,
    [IPU1-0] 70.826267 s:
    [IPU1-0] 70.826328 s: CH | Out | Out | Out Drop | Out User Drop
    [IPU1-0] 70.826389 s: | ID | FPS | FPS | FPS
    [IPU1-0] 70.826480 s: ---------------------------------------------
    [IPU1-0] 70.826572 s: 0 | 0 57.10 2.51 0. 0
    [IPU1-0] 70.826694 s:
    [IPU1-0] 70.826724 s: [ ti.radar.drawfftheatmap ] LATENCY,
    [IPU1-0] 70.826816 s: ********************
    [IPU1-0] 70.826877 s: Local Link Latency : Avg = 10800 us, Min = 10462 us, Max = 68169 us,
    [IPU1-0] 70.826999 s: Source to Link Latency : Avg = 19348 us, Min = 14305 us, Max = 74544 us,
    [IPU1-0] 70.827121 s:

  • Khai,

    It seems like both the network transmit and the radar draw are limiting the overall FPS.

    Notice the ti.radar.drawfftheatmap has an the same in drop and out drop FPS of 2.51. 

    and the ti.radar.fft has an in drop and out drop of 12.83.

    I would suggest the below:

    1. Check the behavior of in and out drop when not connected to the network.  Check the data rates you are generating from the TDA3x using the PC side Task Manager -Network Performance monitorring.

    2. Increase the number of output buffers for the Radar FFT and the FFT draw. This is part of the pFFTParams->baseClassCreateParams.numOutputBuffers. The default is 2, you can increase it to 4 or 5 to see the effect of pipelining would help improve the overall FPS.

    BTW, what is your requirement for the FPS?

    Thanks and Regards,

    Piyali

  • 1. I didn't run network_rx on PC to request for data when captured the above stats. That's why I was surprised that with 12ms, there is still issues with it. I am running network_rx on Linux PC. I can't never able to get network_rx to capture without problems on Windows.

    2. I will try your suggestion tomorrow

    We still desire to complete the chirp frame in sub 5ms. If we limit the amount of data transmitting over the network to like just CFAR target list, and not the entire RDM, in theory we the network transmit time will be kept to minimal. Thus, processing will easily be fall in the 5ms requirements of a chirp frame time. That's the thought. Do you think that's realistic especially if 64 chirps are considered?

    Thanks,
    --Khai
  • Hi Piyali,

    I did a global search and replace all the setting which was 3 to 5 per your suggestion and rerun the use case. Result below which didn't seem to help much. No network request again:

    [IPU1-0] 25.762581 s:
    [IPU1-0] 25.762612 s: [ IPC_IN_0 ] LATENCY,
    [IPU1-0] 25.762703 s: ********************
    [IPU1-0] 25.762764 s: Local Link Latency : Avg = 9 us, Min = 0 us, Max = 61 us,
    [IPU1-0] 25.762917 s: Source to Link Latency : Avg = 4409 us, Min = 183 us, Max = 60087 us,
    [IPU1-0] 25.763039 s:
    [IPU1-0] 25.763313 s:
    [IPU1-0] 25.763374 s: ### CPU [ DSP1], LinkID [ 49],
    [IPU1-0] 25.763435 s:
    [IPU1-0] 25.763496 s: [ ti.radar.fft ] Link Statistics,
    [IPU1-0] 25.763557 s: ******************************
    [IPU1-0] 25.763649 s:
    [IPU1-0] 25.763679 s: Elapsed time = 7520 msec
    [IPU1-0] 25.763740 s:
    [IPU1-0] 25.763801 s: New data Recv = 70.87 fps
    [IPU1-0] 25.763893 s:
    [IPU1-0] 25.763954 s: Input Statistics,
    [IPU1-0] 25.763984 s:
    [IPU1-0] 25.764045 s: CH | In Recv | In Drop | In User Drop | In Process
    [IPU1-0] 25.764106 s: | FPS | FPS | FPS | FPS
    [IPU1-0] 25.764198 s: --------------------------------------------------
    [IPU1-0] 25.764289 s: 0 | 71. 1 11.83 0. 0 59.17
    [IPU1-0] 25.764442 s:
    [IPU1-0] 25.764503 s: Output Statistics,
    [IPU1-0] 25.764564 s:
    [IPU1-0] 25.764625 s: CH | Out | Out | Out Drop | Out User Drop
    [IPU1-0] 25.764716 s: | ID | FPS | FPS | FPS
    [IPU1-0] 25.765052 s: ---------------------------------------------
    [IPU1-0] 25.765204 s: 0 | 0 59.17 11.83 0. 0
    [IPU1-0] 25.765357 s:
    [IPU1-0] 25.765387 s: [ ti.radar.fft ] LATENCY,
    [IPU1-0] 25.765479 s: ********************
    [IPU1-0] 25.765570 s: Local Link Latency : Avg = 2356 us, Min = 2318 us, Max = 2745 us,
    [IPU1-0] 25.765906 s: Source to Link Latency : Avg = 7617 us, Min = 2562 us, Max = 62619 us,
    [IPU1-0] 25.766058 s:
    [IPU1-0] 25.766089 s: CPU [ DSP1], LinkID [ 25], Link Statistics not available !
    [IPU1-0] 25.766241 s:
    [IPU1-0] 25.766302 s: ### CPU [ DSP1], LinkID [ 51],
    [IPU1-0] 25.766363 s:
    [IPU1-0] 25.766394 s: [ ti.radar.drawfftheatmap ] Link Statistics,
    [IPU1-0] 25.766485 s: ******************************
    [IPU1-0] 25.766546 s:
    [IPU1-0] 25.766577 s: Elapsed time = 7520 msec
    [IPU1-0] 25.766638 s:
    [IPU1-0] 25.766699 s: New data Recv = 59.17 fps
    [IPU1-0] 25.766760 s:
    [IPU1-0] 25.766821 s: Input Statistics,
    [IPU1-0] 25.766882 s:
    [IPU1-0] 25.766912 s: CH | In Recv | In Drop | In User Drop | In Process
    [IPU1-0] 25.767004 s: | FPS | FPS | FPS | FPS
    [IPU1-0] 25.767461 s: --------------------------------------------------
    [IPU1-0] 25.767583 s: 0 | 59.17 0. 0 0. 0 59. 4
    [IPU1-0] 25.767705 s:
    [IPU1-0] 25.767736 s: Output Statistics,
    [IPU1-0] 25.767797 s:
    [IPU1-0] 25.767827 s: CH | Out | Out | Out Drop | Out User Drop
    [IPU1-0] 25.767949 s: | ID | FPS | FPS | FPS
    [IPU1-0] 25.768041 s: ---------------------------------------------
    [IPU1-0] 25.768102 s: 0 | 0 59. 4 0. 0 0. 0
    [IPU1-0] 25.768224 s:
    [IPU1-0] 25.768254 s: [ ti.radar.drawfftheatmap ] LATENCY,
    [IPU1-0] 25.768346 s: ********************
    [IPU1-0] 25.768407 s: Local Link Latency : Avg = 10777 us, Min = 10462 us, Max = 68108 us,
    [IPU1-0] 25.768529 s: Source to Link Latency : Avg = 19564 us, Min = 14274 us, Max = 74361 us,
    [IPU1-0] 25.768651 s:
    [IPU1-0] 25.768773 s:
    [IPU1-0] 25.768803 s: ### CPU [ DSP1], LinkID [ 1],
    [IPU1-0] 25.768895 s:
    [IPU1-0] 25.768956 s: [ IPC_OUT_1 ] Link Statistics,
    [IPU1-0] 25.769017 s: ******************************
    [IPU1-0] 25.769078 s:
    [IPU1-0] 25.769108 s: Elapsed time = 7454 msec

  • Khai,

    Apologies for missing this post.

    Can you also please post the complete output of the "p" command?

    It seems that something beyond the algorithms is holding on to the buffers which is causing the algorithms to drop frames.

    Thanks and Regards,
    Piyali
  • [IPU1-0] 59.322698 s:
    [IPU1-0] 59.322759 s: CPU [IPU1-0 ] Statistics,
    [IPU1-0] 59.322820 s: *************************
    [IPU1-0] 59.322881 s:
    [IPU1-0] 59.322942 s: LOAD: CPU: 19.3% HWI: 3.4%, SWI:0.7%, Low Power: 0.0%
    [IPU1-0] 59.323095 s:
    [IPU1-0] 59.323156 s: LOAD: TSK: IPC_IN_0 : 0.8%
    [IPU1-0] 59.323247 s: LOAD: TSK: IPC_OUT_0 : 1.2%
    [IPU1-0] 59.323400 s: LOAD: TSK: DISPLAY0 : 1.5%
    [IPU1-0] 59.323491 s: LOAD: TSK: ISSCAPTURE : 0.5%
    [IPU1-0] 59.323583 s: LOAD: TSK: GrpxSrc0 : 7.8%
    [IPU1-0] 59.323827 s: LOAD: TSK: STAT_COLL : 2.2%
    [IPU1-0] 59.323918 s: LOAD: TSK: MISC : 1.2%
    [IPU1-0] 59.324406 s:
    [IPU1-0] 59.324498 s: SYSTEM: SW Message Box Msg Pool, Free Msg Count = 1023
    [IPU1-0] 59.324559 s:
    [IPU1-0] 59.324620 s: SYSTEM: Sempahores Objects, 268 of 1050 free
    [IPU1-0] 59.324742 s: SYSTEM: Task Objects , 24 of 100 free
    [IPU1-0] 59.324833 s: SYSTEM: Clock Objects , 96 of 100 free
    [IPU1-0] 59.324925 s: SYSTEM: Hwi Objects , 84 of 100 free
    [IPU1-0] 59.325016 s:
    [IPU1-0] 59.325047 s: SYSTEM: Heap = LOCAL_DDR @ 0x00000000, Total size = 262144 B (256 KB), Free size = 258624 B (252 KB)
    [IPU1-0] 59.325230 s: SYSTEM: Heap = SR_OCMC @ 0x00000000, Total size = 0 B (0 KB), Free size = 0 B (0 KB)
    [IPU1-0] 59.325352 s: SYSTEM: Heap = SR_DDR_CACHED @ 0x85703000, Total size = 369086464 B (351 MB), Free size = 328916992 B (313 MB)
    [IPU1-0] 59.325535 s: SYSTEM: Heap = SR_DDR_NON_CACHED @ 0x00000000, Total size = 0 B (0 MB), Free size = 0 B (0 MB)
    [IPU1-0] 59.325718 s:
    [IPU1-0] 59.325748 s:
    [IPU1-0] 59.325809 s: CPU [IPU1-1 ] Statistics,
    [IPU1-0] 59.325870 s: *************************
    [IPU1-0] 59.326297 s:
    [IPU1-0] 59.326389 s: LOAD: CPU: 4.5% HWI: 1.1%, SWI:0.5%, Low Power: 0.0%
    [IPU1-0] 59.326511 s:
    [IPU1-0] 59.326572 s: LOAD: TSK: IPC_IN_0 : 0.9%
    [IPU1-0] 59.326785 s: LOAD: TSK: NETWORK TX0 : 1.1%
    [IPU1-0] 59.326938 s: LOAD: TSK: MISC : 0.9%
    [IPU1-0] 59.327029 s:
    [IPU1-0] 59.327060 s: SYSTEM: SW Message Box Msg Pool, Free Msg Count = 1023
    [IPU1-0] 59.327151 s:
    [IPU1-0] 59.327212 s: SYSTEM: Sempahores Objects, 428 of 1050 free
    [IPU1-0] 59.327304 s: SYSTEM: Task Objects , 36 of 100 free
    [IPU1-0] 59.327395 s: SYSTEM: Clock Objects , 99 of 100 free
    [IPU1-0] 59.327517 s: SYSTEM: Hwi Objects , 97 of 100 free
    [IPU1-0] 59.327609 s:
    [IPU1-0] 59.327639 s: SYSTEM: Heap = LOCAL_DDR @ 0x00000000, Total size = 262144 B (256 KB), Free size = 246224 B (240 KB)
    [IPU1-0] 59.327853 s:
    [IPU1-0] 59.327883 s:
    [IPU1-0] 59.327944 s: CPU [DSP1 ] Statistics,
    [IPU1-0] 59.328005 s: *************************
    [IPU1-0] 59.328066 s:
    [IPU1-0] 59.328127 s: LOAD: CPU: 47.4% HWI: 1.1%, SWI:0.3%, Low Power: 0.0%
    [IPU1-0] 59.328280 s:
    [IPU1-0] 59.328341 s: LOAD: TSK: MISC : 46.0%
    [IPU1-0] 59.328432 s:
    [IPU1-0] 59.328463 s: SYSTEM: SW Message Box Msg Pool, Free Msg Count = 1023
    [IPU1-0] 59.328554 s:
    [IPU1-0] 59.328615 s: SYSTEM: Sempahores Objects, 442 of 1050 free
    [IPU1-0] 59.328981 s: SYSTEM: Task Objects , 91 of 100 free
    [IPU1-0] 59.329103 s: SYSTEM: Clock Objects , 96 of 100 free
    [IPU1-0] 59.329195 s: SYSTEM: Hwi Objects , 98 of 100 free
    [IPU1-0] 59.329317 s:
    [IPU1-0] 59.329347 s: SYSTEM: Heap = LOCAL_L2 @ 0x00800000, Total size = 227264 B (221 KB), Free size = 227264 B (221 KB)
    [IPU1-0] 59.329530 s: SYSTEM: Heap = LOCAL_DDR @ 0x00000000, Total size = 524288 B (512 KB), Free size = 457160 B (446 KB)
    [IPU1-0] 59.329713 s:
    [IPU1-0] 59.329774 s:
    [IPU1-0] 59.329805 s: CPU [EVE1 ] Statistics,
    [IPU1-0] 59.329866 s: *************************
    [IPU1-0] 59.329927 s:
    [IPU1-0] 59.329988 s: LOAD: CPU: 21.8% HWI: 1.3%, SWI:0.2%, Low Power: 0.0%
    [IPU1-0] 59.330140 s:
    [IPU1-0] 59.330171 s: LOAD: TSK: MISC : 20.3%
    [IPU1-0] 59.330262 s:
    [IPU1-0] 59.330293 s: SYSTEM: SW Message Box Msg Pool, Free Msg Count = 1023
    [IPU1-0] 59.330415 s:
    [IPU1-0] 59.330476 s: SYSTEM: Sempahores Objects, 454 of 1050 free
    [IPU1-0] 59.330567 s: SYSTEM: Task Objects , 92 of 100 free
    [IPU1-0] 59.330720 s: SYSTEM: Clock Objects , 99 of 100 free
    [IPU1-0] 59.330842 s: SYSTEM: Hwi Objects , 97 of 100 free
    [IPU1-0] 59.330964 s:
    [IPU1-0] 59.331025 s: SYSTEM: Heap = LOCAL_L2 @ 0x40020000, Total size = 22528 B (22 KB), Free size = 8884 B (8 KB)
    [IPU1-0] 59.331238 s: SYSTEM: Heap = LOCAL_DDR @ 0x00000000, Total size = 262144 B (256 KB), Free size = 261008 B (254 KB)
    [IPU1-0] 59.331452 s:
    [IPU1-0] 59.332001 s:
    [IPU1-0] 59.332062 s: UTILS_PRCM_STATS: Current Temperature,
    [IPU1-0] 59.332123 s:
    [IPU1-0] 59.332153 s: Voltage Rail || Curr Temp Min - Max
    [IPU1-0] 59.332245 s: ---------------------------------------------------------
    [IPU1-0] 59.332336 s: PMHAL_PRCM_VD_CORE || [50.800 , 51.200]
    [IPU1-0] 59.332458 s:
    [IPU1-0] 59.332519 s:
    [IPU1-0] 59.332580 s: Statistics Collector,
    [IPU1-0] 59.332641 s:
    [IPU1-0] 59.332702 s: STATISTIC Avg Data Peak Data
    [IPU1-0] 59.332794 s: COLLECTOR MB/s MB/s
    [IPU1-0] 59.332855 s: --------------------------------------------------
    [IPU1-0] 59.332946 s: SCI_EMIF_SYS | 1235.348673 1952.298724
    [IPU1-0] 59.333068 s: SCI_IPU | 16.951134 44.796344
    [IPU1-0] 59.333190 s: SCI_DSP1_MDMA | 44.533444 61.931303
    [IPU1-0] 59.333282 s: SCI_DSP2_MDMA | 0.000000 0.000000
    [IPU1-0] 59.333404 s: SCI_DSS | 496.049612 522.051406
    [IPU1-0] 59.333587 s: SCI_MMU | 0.000000 0.000000
    [IPU1-0] 59.333862 s: SCI_EDMA_TC0_RD | 0.000000 0.000000
    [IPU1-0] 59.333984 s: SCI_EDMA_TC0_WR | 0.000000 0.000000
    [IPU1-0] 59.334075 s: SCI_VIP_P1 | 0.000000 0.000000
    [IPU1-0] 59.334197 s: SCI_VIP_P2 | 0.000000 0.000000
    [IPU1-0] 59.334289 s: SCI_ISS_RT | 30.877901 106.524185
    [IPU1-0] 59.334411 s: SCI_ISS_NRT2 | 0.000000 0.000000
    [IPU1-0] 59.334502 s: SCI_EVE_P1 | 141.325637 459.914581
    [IPU1-0] 59.334624 s: SCI_EVE_P2 | 65.413529 241.971769
    [IPU1-0] 59.334746 s: SCI_GMAC_SW | 0.000046 0.034761
    [IPU1-0] 59.334868 s: SCI_ISS_NRT1 | 0.000000 0.000000
    [IPU1-0] 59.334960 s: SCI_DSP2_CFG | 0.000000 0.000000
    [IPU1-0] 59.335051 s: SCI_DSP2_EDMA | 0.000000 0.000000
    [IPU1-0] 59.335173 s: SCI_OCMC_RAM | 0.000000 0.000000
    [IPU1-0] 59.335265 s: SCI_DSP1_CFG | 0.006583 0.022950
    [IPU1-0] 59.335356 s: SCI_DSP1_EDMA | 0.000000 0.000000
    [IPU1-0] 59.335478 s: SCI_GPMC | 0.000000 0.000000
    [IPU1-0] 59.335570 s: SCI_MCASP | 0.000000 0.000000
    [IPU1-0] 59.335692 s: SCI_EDMA_TC1_RD | 224.722738 389.424557
    [IPU1-0] 59.335814 s: SCI_EDMA_TC1_WR | 224.759848 389.424557
    [IPU1-0] 59.435704 s:
    [IPU1-0] 59.435765 s:
    [IPU1-0] 59.435856 s:
    [IPU1-0] 59.435917 s: ### CPU [IPU1-0], LinkID [ 81],
    [IPU1-0] 59.436039 s:
    [IPU1-0] 59.436344 s: [ ISSCAPTURE ] Link Statistics,
    [IPU1-0] 59.436436 s: ******************************
    [IPU1-0] 59.436497 s:
    [IPU1-0] 59.436527 s: Elapsed time = 44806 msec
    [IPU1-0] 59.436588 s:
    [IPU1-0] 59.436649 s: Get Full Buf Cb = 58.76 fps
    [IPU1-0] 59.436771 s: Put Empty Buf Cb = 58.74 fps
    [IPU1-0] 59.436832 s: Driver/Notify Cb = 58.80 fps
    [IPU1-0] 59.436924 s:
    [IPU1-0] 59.436954 s: Input Statistics,
    [IPU1-0] 59.437015 s:
    [IPU1-0] 59.437046 s: CH | In Recv | In Drop | In User Drop | In Process
    [IPU1-0] 59.437137 s: | FPS | FPS | FPS | FPS
    [IPU1-0] 59.437198 s: --------------------------------------------------
    [IPU1-0] 59.437290 s: 0 | 58.76 0. 0 0. 0 58.76
    [IPU1-0] 59.437534 s:
    [IPU1-0] 59.437564 s: Output Statistics,
    [IPU1-0] 59.437625 s:
    [IPU1-0] 59.437656 s: CH | Out | Out | Out Drop | Out User Drop
    [IPU1-0] 59.437747 s: | ID | FPS | FPS | FPS
    [IPU1-0] 59.437839 s: ---------------------------------------------
    [IPU1-0] 59.437900 s: 0 | 0 58.76 0. 0 0. 0
    [IPU1-0] 59.438022 s:
    [IPU1-0] 59.438052 s: [ ISSCAPTURE ] LATENCY,
    [IPU1-0] 59.438113 s: ********************
    [IPU1-0] 59.438174 s:
    [IPU1-0] 59.438296 s:
    [IPU1-0] 59.438357 s: ### CPU [IPU1-0], LinkID [ 0],
    [IPU1-0] 59.438418 s:
    [IPU1-0] 59.438479 s: [ IPC_OUT_0 ] Link Statistics,
    [IPU1-0] 59.438540 s: ******************************
    [IPU1-0] 59.438601 s:
    [IPU1-0] 59.438632 s: Elapsed time = 44808 msec
    [IPU1-0] 59.438876 s:
    [IPU1-0] 59.438906 s: New data Recv = 58.76 fps
    [IPU1-0] 59.438998 s: Release data Recv = 58.76 fps
    [IPU1-0] 59.439059 s: Driver/Notify Cb = 158.74 fps
    [IPU1-0] 59.439150 s:
    [IPU1-0] 59.439181 s: Input Statistics,
    [IPU1-0] 59.439242 s:
    [IPU1-0] 59.439272 s: CH | In Recv | In Drop | In User Drop | In Process
    [IPU1-0] 59.439364 s: | FPS | FPS | FPS | FPS
    [IPU1-0] 59.439425 s: --------------------------------------------------
    [IPU1-0] 59.439516 s: 0 | 58.76 0. 0 0. 0 58.76
    [IPU1-0] 59.439638 s:
    [IPU1-0] 59.439730 s: Output Statistics,
    [IPU1-0] 59.439760 s:
    [IPU1-0] 59.439821 s: CH | Out | Out | Out Drop | Out User Drop
    [IPU1-0] 59.439913 s: | ID | FPS | FPS | FPS
    [IPU1-0] 59.440035 s: ---------------------------------------------
    [IPU1-0] 59.440157 s: 0 | 0 58.76 0. 0 0. 0
    [IPU1-0] 59.440279 s:
    [IPU1-0] 59.440340 s: [ IPC_OUT_0 ] LATENCY,
    [IPU1-0] 59.440431 s: ********************
    [IPU1-0] 59.440523 s: Local Link Latency : Avg = 9 us, Min = 0 us, Max = 183 us,
    [IPU1-0] 59.440706 s: Source to Link Latency : Avg = 95 us, Min = 61 us, Max = 335 us,
    [IPU1-0] 59.440889 s:
    [IPU1-0] 59.940950 s:
    [IPU1-0] 59.941011 s: ### CPU [ DSP1], LinkID [ 10],
    [IPU1-0] 59.941102 s:
    [IPU1-0] 59.941133 s: [ IPC_IN_0 ] Link Statistics,
    [IPU1-0] 59.941224 s: ******************************
    [IPU1-0] 59.941285 s:
    [IPU1-0] 59.941346 s: Elapsed time = 45311 msec
    [IPU1-0] 59.941407 s:
    [IPU1-0] 59.941468 s: Get Full Buf Cb = 58.74 fps
    [IPU1-0] 59.941529 s: Put Empty Buf Cb = 58.77 fps
    [IPU1-0] 59.941621 s: Driver/Notify Cb = 58.74 fps
    [IPU1-0] 59.941712 s:
    [IPU1-0] 59.941773 s: Input Statistics,
    [IPU1-0] 59.941834 s:
    [IPU1-0] 59.941865 s: CH | In Recv | In Drop | In User Drop | In Process
    [IPU1-0] 59.941956 s: | FPS | FPS | FPS | FPS
    [IPU1-0] 59.942017 s: --------------------------------------------------
    [IPU1-0] 59.942109 s: 0 | 58.77 0. 0 0. 0 58.77
    [IPU1-0] 59.942322 s:
    [IPU1-0] 59.942383 s: Output Statistics,
    [IPU1-0] 59.942475 s:
    [IPU1-0] 59.942505 s: CH | Out | Out | Out Drop | Out User Drop
    [IPU1-0] 59.942627 s: | ID | FPS | FPS | FPS
    [IPU1-0] 59.942749 s: ---------------------------------------------
    [IPU1-0] 59.942871 s: 0 | 0 58.77 0. 0 0. 0
    [IPU1-0] 59.943024 s:
    [IPU1-0] 59.943085 s: [ IPC_IN_0 ] LATENCY,
    [IPU1-0] 59.943176 s: ********************
    [IPU1-0] 59.943237 s: Local Link Latency : Avg = 8 us, Min = 0 us, Max = 31 us,
    [IPU1-0] 59.943420 s: Source to Link Latency : Avg = 239 us, Min = 183 us, Max = 49747 us,
    [IPU1-0] 59.943573 s:
    [IPU1-0] 59.943939 s:
    [IPU1-0] 59.944000 s: ### CPU [ DSP1], LinkID [ 49],
    [IPU1-0] 59.944091 s:
    [IPU1-0] 59.944122 s: [ ti.radar.fft ] Link Statistics,
    [IPU1-0] 59.944183 s: ******************************
    [IPU1-0] 59.944244 s:
    [IPU1-0] 59.944305 s: Elapsed time = 45314 msec
    [IPU1-0] 59.944366 s:
    [IPU1-0] 59.944396 s: New data Recv = 58.74 fps
    [IPU1-0] 59.944488 s:
    [IPU1-0] 59.944519 s: Input Statistics,
    [IPU1-0] 59.944580 s:
    [IPU1-0] 59.944610 s: CH | In Recv | In Drop | In User Drop | In Process
    [IPU1-0] 59.944702 s: | FPS | FPS | FPS | FPS
    [IPU1-0] 59.944793 s: --------------------------------------------------
    [IPU1-0] 59.944885 s: 0 | 58.76 0. 2 0. 0 58.74
    [IPU1-0] 59.945007 s:
    [IPU1-0] 59.945037 s: Output Statistics,
    [IPU1-0] 59.945098 s:
    [IPU1-0] 59.945129 s: CH | Out | Out | Out Drop | Out User Drop
    [IPU1-0] 59.945220 s: | ID | FPS | FPS | FPS
    [IPU1-0] 59.945281 s: ---------------------------------------------
    [IPU1-0] 59.945373 s: 0 | 0 58.74 0. 2 0. 0
    [IPU1-0] 59.945464 s:
    [IPU1-0] 59.945525 s: [ ti.radar.fft ] LATENCY,
    [IPU1-0] 59.945586 s: ********************
    [IPU1-0] 59.945647 s: Local Link Latency : Avg = 2375 us, Min = 2318 us, Max = 3264 us,
    [IPU1-0] 59.945769 s: Source to Link Latency : Avg = 2647 us, Min = 2562 us, Max = 52279 us,
    [IPU1-0] 59.945922 s:
    [IPU1-0] 59.945983 s: CPU [ DSP1], LinkID [ 25], Link Statistics not available !
    [IPU1-0] 59.946135 s:
    [IPU1-0] 59.946166 s: ### CPU [ DSP1], LinkID [ 51],
    [IPU1-0] 59.946257 s:
    [IPU1-0] 59.946288 s: [ ti.radar.drawfftheatmap ] Link Statistics,
    [IPU1-0] 59.946379 s: ******************************
    [IPU1-0] 59.946440 s:
    [IPU1-0] 59.946471 s: Elapsed time = 45312 msec
    [IPU1-0] 59.946532 s:
    [IPU1-0] 59.946593 s: New data Recv = 58.74 fps
    [IPU1-0] 59.946654 s:
    [IPU1-0] 59.946715 s: Input Statistics,
    [IPU1-0] 59.946776 s:
    [IPU1-0] 59.946837 s: CH | In Recv | In Drop | In User Drop | In Process
    [IPU1-0] 59.946898 s: | FPS | FPS | FPS | FPS
    [IPU1-0] 59.946989 s: --------------------------------------------------
    [IPU1-0] 59.947081 s: 0 | 58.74 0. 0 0. 0 58.72
    [IPU1-0] 59.947294 s:
    [IPU1-0] 59.947325 s: Output Statistics,
    [IPU1-0] 59.947386 s:
    [IPU1-0] 59.947416 s: CH | Out | Out | Out Drop | Out User Drop
    [IPU1-0] 59.947477 s: | ID | FPS | FPS | FPS
    [IPU1-0] 59.947569 s: ---------------------------------------------
    [IPU1-0] 59.947630 s: 0 | 0 58.72 0. 0 0. 0
    [IPU1-0] 59.947782 s:
    [IPU1-0] 59.947813 s: [ ti.radar.drawfftheatmap ] LATENCY,
    [IPU1-0] 59.947904 s: ********************
    [IPU1-0] 59.947965 s: Local Link Latency : Avg = 10625 us, Min = 10431 us, Max = 62465 us,
    [IPU1-0] 59.948087 s: Source to Link Latency : Avg = 14761 us, Min = 14518 us, Max = 66613 us,
    [IPU1-0] 59.948209 s:
    [IPU1-0] 59.948301 s:
    [IPU1-0] 59.948362 s: ### CPU [ DSP1], LinkID [ 1],
    [IPU1-0] 59.948423 s:
    [IPU1-0] 59.948453 s: [ IPC_OUT_1 ] Link Statistics,
    [IPU1-0] 59.948545 s: ******************************
    [IPU1-0] 59.948606 s:
    [IPU1-0] 59.948636 s: Elapsed time = 45251 msec
    [IPU1-0] 59.948819 s:
    [IPU1-0] 59.948880 s: New data Recv = 58.80 fps
    [IPU1-0] 59.948972 s: Release data Recv = 58.98 fps
    [IPU1-0] 59.949033 s: Driver/Notify Cb = 158.75 fps
    [IPU1-0] 59.949124 s:
    [IPU1-0] 59.949155 s: Input Statistics,
    [IPU1-0] 59.949216 s:
    [IPU1-0] 59.949246 s: CH | In Recv | In Drop | In User Drop | In Process
    [IPU1-0] 59.949307 s: | FPS | FPS | FPS | FPS
    [IPU1-0] 59.949399 s: --------------------------------------------------
    [IPU1-0] 59.949490 s: 0 | 58.80 0. 0 0. 0 58.80
    [IPU1-0] 59.949612 s:
    [IPU1-0] 59.949643 s: Output Statistics,
    [IPU1-0] 59.949734 s:
    [IPU1-0] 59.949765 s: CH | Out | Out | Out Drop | Out User Drop
    [IPU1-0] 59.949856 s: | ID | FPS | FPS | FPS
    [IPU1-0] 59.949978 s: ---------------------------------------------
    [IPU1-0] 59.950070 s: 0 | 0 58.80 0. 0 0. 0
    [IPU1-0] 59.950222 s:
    [IPU1-0] 59.950283 s: [ IPC_OUT_1 ] LATENCY,
    [IPU1-0] 59.950375 s: ********************
    [IPU1-0] 59.950436 s: Local Link Latency : Avg = 3 us, Min = 0 us, Max = 31 us,
    [IPU1-0] 59.950619 s: Source to Link Latency : Avg = 14909 us, Min = 14641 us, Max = 66857 us,
    [IPU1-0] 59.950802 s:
    [IPU1-0] 60.450771 s:
    [IPU1-0] 60.451015 s: ### CPU [IPU1-0], LinkID [ 10],
    [IPU1-0] 60.451107 s:
    [IPU1-0] 60.451168 s: [ IPC_IN_0 ] Link Statistics,
    [IPU1-0] 60.451229 s: ******************************
    [IPU1-0] 60.451320 s:
    [IPU1-0] 60.451351 s: Elapsed time = 45754 msec
    [IPU1-0] 60.451442 s:
    [IPU1-0] 60.451473 s: Get Full Buf Cb = 58.81 fps
    [IPU1-0] 60.451564 s: Put Empty Buf Cb = 58.77 fps
    [IPU1-0] 60.451625 s: Driver/Notify Cb = 58.79 fps
    [IPU1-0] 60.451747 s:
    [IPU1-0] 60.451778 s: Input Statistics,
    [IPU1-0] 60.451839 s:
    [IPU1-0] 60.451869 s: CH | In Recv | In Drop | In User Drop | In Process
    [IPU1-0] 60.451961 s: | FPS | FPS | FPS | FPS
    [IPU1-0] 60.452022 s: --------------------------------------------------
    [IPU1-0] 60.452113 s: 0 | 58.81 0. 0 0. 0 58.81
    [IPU1-0] 60.452235 s:
    [IPU1-0] 60.452296 s: Output Statistics,
    [IPU1-0] 60.452327 s:
    [IPU1-0] 60.452388 s: CH | Out | Out | Out Drop | Out User Drop
    [IPU1-0] 60.452510 s: | ID | FPS | FPS | FPS
    [IPU1-0] 60.452601 s: ---------------------------------------------
    [IPU1-0] 60.453303 s: 0 | 0 58.81 0. 0 0. 0
    [IPU1-0] 60.453486 s:
    [IPU1-0] 60.453547 s: [ IPC_IN_0 ] LATENCY,
    [IPU1-0] 60.453638 s: ********************
    [IPU1-0] 60.453913 s: Local Link Latency : Avg = 21 us, Min = 0 us, Max = 153 us,
    [IPU1-0] 60.454035 s: Source to Link Latency : Avg = 15080 us, Min = 14823 us, Max = 67040 us,
    [IPU1-0] 60.454157 s:
    [IPU1-0] 60.454279 s:
    [IPU1-0] 60.454309 s: ### CPU [IPU1-0], LinkID [ 71],
    [IPU1-0] 60.454401 s:
    [IPU1-0] 60.454431 s: [ DISPLAY ] Link Statistics,
    [IPU1-0] 60.454492 s: ******************************
    [IPU1-0] 60.454553 s:
    [IPU1-0] 60.454614 s: Elapsed time = 45757 msec
    [IPU1-0] 60.454675 s:
    [IPU1-0] 60.454736 s: New data Recv = 58.78 fps
    [IPU1-0] 60.454828 s: Driver/Notify Cb = 60.1 fps
    [IPU1-0] 60.454889 s:
    [IPU1-0] 60.454950 s: Input Statistics,
    [IPU1-0] 60.454980 s:
    [IPU1-0] 60.455041 s: CH | In Recv | In Drop | In User Drop | In Process
    [IPU1-0] 60.455102 s: | FPS | FPS | FPS | FPS
    [IPU1-0] 60.455194 s: --------------------------------------------------
    [IPU1-0] 60.455255 s: 0 | 58.81 0. 0 0. 0 58.81
    [IPU1-0] 60.455407 s:
    [IPU1-0] 60.455438 s: [ DISPLAY ] LATENCY,
    [IPU1-0] 60.455499 s: ********************
    [IPU1-0] 60.455560 s: Local Link Latency : Avg = 83 us, Min = 31 us, Max = 214 us,
    [IPU1-0] 60.455682 s: Source to Link Latency : Avg = 15280 us, Min = 15006 us, Max = 67223 us,
    [IPU1-0] 60.455804 s:
    [IPU1-0] 60.455865 s: Display UnderFlow Count = 0
    [IPU1-0] 60.455926 s:
    [IPU1-0] 61.037882 s:
    [IPU1-0] 61.037973 s: ### CPU [ DSP1], LinkID [ 50],
    [IPU1-0] 61.038065 s:
    [IPU1-0] 61.038126 s: [ ti.radar.pkDetect ] Link Statistics,
    [IPU1-0] 61.038248 s: ******************************
    [IPU1-0] 61.038339 s:
    [IPU1-0] 61.038400 s: Elapsed time = 46405 msec
    [IPU1-0] 61.038492 s:
    [IPU1-0] 61.038553 s: New data Recv = 58.74 fps
    [IPU1-0] 61.038644 s:
    [IPU1-0] 61.038705 s: Input Statistics,
    [IPU1-0] 61.039010 s:
    [IPU1-0] 61.039071 s: CH | In Recv | In Drop | In User Drop | In Process
    [IPU1-0] 61.039193 s: | FPS | FPS | FPS | FPS
    [IPU1-0] 61.039315 s: --------------------------------------------------
    [IPU1-0] 61.039437 s: 0 | 58.74 0. 0 0. 0 58.74
    [IPU1-0] 61.039620 s:
    [IPU1-0] 61.039651 s: Output Statistics,
    [IPU1-0] 61.039712 s:
    [IPU1-0] 61.039773 s: CH | Out | Out | Out Drop | Out User Drop
    [IPU1-0] 61.039834 s: | ID | FPS | FPS | FPS
    [IPU1-0] 61.039925 s: ---------------------------------------------
    [IPU1-0] 61.040017 s: 0 | 0 58.74 0. 0 0. 0
    [IPU1-0] 61.040108 s:
    [IPU1-0] 61.040169 s: [ ti.radar.pkDetect ] LATENCY,
    [IPU1-0] 61.040230 s: ********************
    [IPU1-0] 61.040291 s: Local Link Latency : Avg = 1296 us, Min = 1220 us, Max = 2196 us,
    [IPU1-0] 61.040413 s: Source to Link Latency : Avg = 4076 us, Min = 3965 us, Max = 53712 us,
    [IPU1-0] 61.040535 s:
    [IPU1-0] 61.040596 s: CPU [ DSP1], LinkID [ 38], Link Statistics not available !
    [IPU1-0] 61.040749 s:
    [IPU1-0] 61.040810 s: ### CPU [ DSP1], LinkID [ 34],
    [IPU1-0] 61.040871 s:
    [IPU1-0] 61.040932 s: [ SYNC_0 ] Link Statistics,
    [IPU1-0] 61.040993 s: ******************************
    [IPU1-0] 61.041054 s:
    [IPU1-0] 61.041084 s: Elapsed time = 46579 msec
    [IPU1-0] 61.041572 s:
    [IPU1-0] 61.041633 s: New data Recv = 128.1 fps
    [IPU1-0] 61.041755 s: Get Full Buf Cb = 58.50 fps
    [IPU1-0] 61.041938 s: Put Empty Buf Cb = 58.48 fps
    [IPU1-0] 61.041999 s: Driver/Notify Cb = 30.29 fps
    [IPU1-0] 61.042091 s:
    [IPU1-0] 61.042121 s: Input Statistics,
    [IPU1-0] 61.042182 s:
    [IPU1-0] 61.042213 s: CH | In Recv | In Drop | In User Drop | In Process
    [IPU1-0] 61.042304 s: | FPS | FPS | FPS | FPS
    [IPU1-0] 61.042365 s: --------------------------------------------------
    [IPU1-0] 61.042457 s: 0 | 58.52 0. 0 0. 0 58.50
    [IPU1-0] 61.042579 s: 1 | 58.50 0. 0 0. 0 58.50
    [IPU1-0] 61.042731 s:
    [IPU1-0] 61.042792 s: Output Statistics,
    [IPU1-0] 61.042823 s:
    [IPU1-0] 61.042884 s: CH | Out | Out | Out Drop | Out User Drop
    [IPU1-0] 61.042945 s: | ID | FPS | FPS | FPS
    [IPU1-0] 61.043402 s: ---------------------------------------------
    [IPU1-0] 61.043494 s: 0 | 0 58.50 0. 0 0. 0
    [IPU1-0] 61.043616 s:
    [IPU1-0] 61.043677 s: [ SYNC_0 ] LATENCY,
    [IPU1-0] 61.043921 s: ********************
    [IPU1-0] 61.043982 s: Local Link Latency : Avg = 6095 us, Min = 0 us, Max = 64082 us,
    [IPU1-0] 61.044134 s: Source to Link Latency : Avg = 14936 us, Min = 14640 us, Max = 66827 us,
    [IPU1-0] 61.044256 s:
    [IPU1-0] 61.044409 s:
    [IPU1-0] 61.044470 s: ### CPU [ DSP1], LinkID [ 0],
    [IPU1-0] 61.044561 s:
    [IPU1-0] 61.044622 s: [ IPC_OUT_0 ] Link Statistics,
    [IPU1-0] 61.044683 s: ******************************
    [IPU1-0] 61.044775 s:
    [IPU1-0] 61.044805 s: Elapsed time = 46347 msec
    [IPU1-0] 61.044897 s:
    [IPU1-0] 61.044927 s: New data Recv = 58.81 fps
    [IPU1-0] 61.045019 s: Release data Recv = 58.83 fps
    [IPU1-0] 61.045080 s: Driver/Notify Cb = 158.80 fps
    [IPU1-0] 61.045171 s:
    [IPU1-0] 61.045232 s: Input Statistics,
    [IPU1-0] 61.045293 s:
    [IPU1-0] 61.045324 s: CH | In Recv | In Drop | In User Drop | In Process
    [IPU1-0] 61.045415 s: | FPS | FPS | FPS | FPS
    [IPU1-0] 61.045507 s: --------------------------------------------------
    [IPU1-0] 61.045598 s: 0 | 58.81 0. 0 0. 0 58.81
    [IPU1-0] 61.045751 s:
    [IPU1-0] 61.045812 s: Output Statistics,
    [IPU1-0] 61.045873 s:
    [IPU1-0] 61.045903 s: CH | Out | Out | Out Drop | Out User Drop
    [IPU1-0] 61.046147 s: | ID | FPS | FPS | FPS
    [IPU1-0] 61.046239 s: ---------------------------------------------
    [IPU1-0] 61.046330 s: 0 | 0 58.81 0. 0 0. 0
    [IPU1-0] 61.046452 s:
    [IPU1-0] 61.046513 s: [ IPC_OUT_0 ] LATENCY,
    [IPU1-0] 61.046574 s: ********************
    [IPU1-0] 61.046635 s: Local Link Latency : Avg = 3 us, Min = 0 us, Max = 31 us,
    [IPU1-0] 61.046788 s: Source to Link Latency : Avg = 14983 us, Min = 14701 us, Max = 66918 us,
    [IPU1-0] 61.046910 s:
    [IPU1-0] 61.546818 s:
    [IPU1-0] 61.546879 s: ### CPU [IPU1-1], LinkID [ 10],
    [IPU1-0] 61.546971 s:
    [IPU1-0] 61.547001 s: [ IPC_IN_0 ] Link Statistics,
    [IPU1-0] 61.547093 s: ******************************
    [IPU1-0] 61.547154 s:
    [IPU1-0] 61.547184 s: Elapsed time = 46849 msec
    [IPU1-0] 61.547245 s:
    [IPU1-0] 61.547306 s: Get Full Buf Cb = 58.80 fps
    [IPU1-0] 61.547367 s: Put Empty Buf Cb = 58.80 fps
    [IPU1-0] 61.547459 s: Driver/Notify Cb = 58.78 fps
    [IPU1-0] 61.547520 s:
    [IPU1-0] 61.547550 s: Input Statistics,
    [IPU1-0] 61.547611 s:
    [IPU1-0] 61.547642 s: CH | In Recv | In Drop | In User Drop | In Process
    [IPU1-0] 61.547764 s: | FPS | FPS | FPS | FPS
    [IPU1-0] 61.547825 s: --------------------------------------------------
    [IPU1-0] 61.547916 s: 0 | 58.80 0. 0 0. 0 58.80
    [IPU1-0] 61.548038 s:
    [IPU1-0] 61.548099 s: Output Statistics,
    [IPU1-0] 61.548191 s:
    [IPU1-0] 61.548221 s: CH | Out | Out | Out Drop | Out User Drop
    [IPU1-0] 61.548343 s: | ID | FPS | FPS | FPS
    [IPU1-0] 61.548465 s: ---------------------------------------------
    [IPU1-0] 61.548557 s: 0 | 0 58.80 0. 0 0. 0
    [IPU1-0] 61.548892 s:
    [IPU1-0] 61.548953 s: [ IPC_IN_0 ] LATENCY,
    [IPU1-0] 61.549045 s: ********************
    [IPU1-0] 61.549106 s: Local Link Latency : Avg = 35 us, Min = 30 us, Max = 92 us,
    [IPU1-0] 61.549289 s: Source to Link Latency : Avg = 15179 us, Min = 14914 us, Max = 67132 us,
    [IPU1-0] 61.549441 s:
    [IPU1-0] 61.549624 s:
    [IPU1-0] 61.549655 s: ### CPU [IPU1-1], LinkID [ 63],
    [IPU1-0] 61.549807 s:
    [IPU1-0] 61.549838 s: [ NETWORK TX ] Link Statistics,
    [IPU1-0] 61.549929 s: ******************************
    [IPU1-0] 61.549990 s:
    [IPU1-0] 61.550021 s: Elapsed time = 46852 msec
    [IPU1-0] 61.550082 s:
    [IPU1-0] 61.550143 s: New data Recv = 58.78 fps
    [IPU1-0] 61.550204 s:
    [IPU1-0] 61.550234 s: Input Statistics,
    [IPU1-0] 61.550295 s:
    [IPU1-0] 61.550326 s: CH | In Recv | In Drop | In User Drop | In Process
    [IPU1-0] 61.550417 s: | FPS | FPS | FPS | FPS
    [IPU1-0] 61.550478 s: --------------------------------------------------
    [IPU1-0] 61.550570 s: 0 | 58.80 0. 0 0. 0 58.80
    [IPU1-0] 61.550814 s:
    [IPU1-0] 61.550844 s: [ NETWORK TX ] LATENCY,
    [IPU1-0] 61.550905 s: ********************
    [IPU1-0] 61.550966 s: Local Link Latency : Avg = 163 us, Min = 122 us, Max = 732 us,
    [IPU1-0] 61.551088 s: Source to Link Latency : Avg = 15307 us, Min = 15036 us, Max = 67284 us,
    [IPU1-0] 61.551210 s:
    [IPU1-0] 62.050783 s: CPU [ IPU1-0], LinkID [ 23], Link Statistics not available !
    [IPU1-0] 62.051119 s:
    [IPU1-0] 62.051180 s: ### CPU [IPU1-0], LinkID [ 72],
    [IPU1-0] 62.051271 s:
    [IPU1-0] 62.051332 s: [ DISPLAY ] Link Statistics,
    [IPU1-0] 62.051424 s: ******************************
    [IPU1-0] 62.051485 s:
    [IPU1-0] 62.051546 s: Elapsed time = 47624 msec
    [IPU1-0] 62.051637 s:
    [IPU1-0] 62.051698 s: Driver/Notify Cb = 59.99 fps
    [IPU1-0] 62.051820 s:
    [IPU1-0] 62.051881 s: Input Statistics,
    [IPU1-0] 62.051942 s:
    [IPU1-0] 62.052003 s: CH | In Recv | In Drop | In User Drop | In Process
    [IPU1-0] 62.052095 s: | FPS | FPS | FPS | FPS
    [IPU1-0] 62.052186 s: --------------------------------------------------
    [IPU1-0] 62.052247 s: 0 | 0. 2 0. 0 0. 0 0. 2
    [IPU1-0] 62.052400 s:
    [IPU1-0] 62.052430 s: [ DISPLAY ] LATENCY,
    [IPU1-0] 62.052491 s: ********************
    [IPU1-0] 62.052552 s: Local Link Latency : Avg = 30 us, Min = 30 us, Max = 30 us,
    [IPU1-0] 62.052644 s: Source to Link Latency : Avg = 19673 us, Min = 19673 us, Max = 19673 us,
    [IPU1-0] 62.053101 s:
    [IPU1-0] 62.053132 s: Display UnderFlow Count = 0
    [IPU1-0] 62.053223 s:
    [IPU1-0] 62.552796 s:
    [IPU1-0]
    [IPU1-0] ====================
    [IPU1-0] Chains Run-time Menu
    [IPU1-0] ====================
    [IPU1-0]
    [IPU1-0] 0: Stop Chain
    [IPU1-0]
    [IPU1-0] c: Read-back and Check AR params
    [IPU1-0]
    [IPU1-0] d: Dynamically change params
    [IPU1-0]
    [IPU1-0] p: Print Performance Statistics
    [IPU1-0]
    [IPU1-0] Enter Choice:
    [IPU1-0]

  • Hi Piyali,

    Sorry. The previous dump was for when the framePeriodicity was set at 17ms which we know exhibited no FPS drop. I recaptured the 12ms below:

    Thanks,

    --Khai


    [IPU1-0]
    [IPU1-0] 37.931891 s:
    [IPU1-0] 37.931983 s: CPU [IPU1-0 ] Statistics,
    [IPU1-0] 37.932044 s: *************************
    [IPU1-0] 37.932105 s:
    [IPU1-0] 37.932166 s: LOAD: CPU: 21.2% HWI: 4.1%, SWI:0.7%, Low Power: 0.0%
    [IPU1-0] 37.932318 s:
    [IPU1-0] 37.932379 s: LOAD: TSK: IPC_IN_0 : 0.8%
    [IPU1-0] 37.932501 s: LOAD: TSK: IPC_OUT_0 : 1.7%
    [IPU1-0] 37.932654 s: LOAD: TSK: DISPLAY0 : 1.6%
    [IPU1-0] 37.932776 s: LOAD: TSK: ISSCAPTURE : 0.9%
    [IPU1-0] 37.933203 s: LOAD: TSK: GrpxSrc0 : 7.9%
    [IPU1-0] 37.933325 s: LOAD: TSK: STAT_COLL : 2.3%
    [IPU1-0] 37.933447 s: LOAD: TSK: MISC : 1.2%
    [IPU1-0] 37.933965 s:
    [IPU1-0] 37.934057 s: SYSTEM: SW Message Box Msg Pool, Free Msg Count = 1023
    [IPU1-0] 37.934148 s:
    [IPU1-0] 37.934179 s: SYSTEM: Sempahores Objects, 268 of 1050 free
    [IPU1-0] 37.934270 s: SYSTEM: Task Objects , 24 of 100 free
    [IPU1-0] 37.934362 s: SYSTEM: Clock Objects , 96 of 100 free
    [IPU1-0] 37.934453 s: SYSTEM: Hwi Objects , 84 of 100 free
    [IPU1-0] 37.934545 s:
    [IPU1-0] 37.934606 s: SYSTEM: Heap = LOCAL_DDR @ 0x00000000, Total size = 262144 B (256 KB), Free size = 258624 B (252 KB)
    [IPU1-0] 37.934880 s: SYSTEM: Heap = SR_OCMC @ 0x00000000, Total size = 0 B (0 KB), Free size = 0 B (0 KB)
    [IPU1-0] 37.935124 s: SYSTEM: Heap = SR_DDR_CACHED @ 0x85703000, Total size = 369086464 B (351 MB), Free size = 328916992 B (313 MB)
    [IPU1-0] 37.935368 s: SYSTEM: Heap = SR_DDR_NON_CACHED @ 0x00000000, Total size = 0 B (0 MB), Free size = 0 B (0 MB)
    [IPU1-0] 37.935582 s:
    [IPU1-0] 37.935643 s:
    [IPU1-0] 37.935704 s: CPU [IPU1-1 ] Statistics,
    [IPU1-0] 37.935826 s: *************************
    [IPU1-0] 37.935917 s:
    [IPU1-0] 37.935978 s: LOAD: CPU: 4.8% HWI: 1.2%, SWI:0.5%, Low Power: 0.0%
    [IPU1-0] 37.936161 s:
    [IPU1-0] 37.936253 s: LOAD: TSK: IPC_IN_0 : 1.0%
    [IPU1-0] 37.936375 s: LOAD: TSK: NETWORK TX0 : 1.2%
    [IPU1-0] 37.936497 s: LOAD: TSK: MISC : 0.9%
    [IPU1-0] 37.936588 s:
    [IPU1-0] 37.936619 s: SYSTEM: SW Message Box Msg Pool, Free Msg Count = 1023
    [IPU1-0] 37.936710 s:
    [IPU1-0] 37.936741 s: SYSTEM: Sempahores Objects, 428 of 1050 free
    [IPU1-0] 37.936863 s: SYSTEM: Task Objects , 36 of 100 free
    [IPU1-0] 37.936924 s: SYSTEM: Clock Objects , 99 of 100 free
    [IPU1-0] 37.937015 s: SYSTEM: Hwi Objects , 97 of 100 free
    [IPU1-0] 37.937107 s:
    [IPU1-0] 37.937168 s: SYSTEM: Heap = LOCAL_DDR @ 0x00000000, Total size = 262144 B (256 KB), Free size = 246224 B (240 KB)
    [IPU1-0] 37.937320 s:
    [IPU1-0] 37.937351 s:
    [IPU1-0] 37.937412 s: CPU [DSP1 ] Statistics,
    [IPU1-0] 37.937473 s: *************************
    [IPU1-0] 37.937534 s:
    [IPU1-0] 37.937564 s: LOAD: CPU: 48.5% HWI: 1.1%, SWI:0.3%, Low Power: 0.0%
    [IPU1-0] 37.937717 s:
    [IPU1-0] 37.937747 s: LOAD: TSK: MISC : 47.1%
    [IPU1-0] 37.937961 s:
    [IPU1-0] 37.938022 s: SYSTEM: SW Message Box Msg Pool, Free Msg Count = 1023
    [IPU1-0] 37.938113 s:
    [IPU1-0] 37.938144 s: SYSTEM: Sempahores Objects, 442 of 1050 free
    [IPU1-0] 37.938235 s: SYSTEM: Task Objects , 91 of 100 free
    [IPU1-0] 37.938327 s: SYSTEM: Clock Objects , 96 of 100 free
    [IPU1-0] 37.938418 s: SYSTEM: Hwi Objects , 98 of 100 free
    [IPU1-0] 37.938510 s:
    [IPU1-0] 37.938540 s: SYSTEM: Heap = LOCAL_L2 @ 0x00800000, Total size = 227264 B (221 KB), Free size = 227264 B (221 KB)
    [IPU1-0] 37.938693 s: SYSTEM: Heap = LOCAL_DDR @ 0x00000000, Total size = 524288 B (512 KB), Free size = 457160 B (446 KB)
    [IPU1-0] 37.938876 s:
    [IPU1-0] 37.938937 s:
    [IPU1-0] 37.938967 s: CPU [EVE1 ] Statistics,
    [IPU1-0] 37.939028 s: *************************
    [IPU1-0] 37.939089 s:
    [IPU1-0] 37.939150 s: LOAD: CPU: 22.1% HWI: 1.3%, SWI:0.2%, Low Power: 0.0%
    [IPU1-0] 37.939272 s:
    [IPU1-0] 37.939333 s: LOAD: TSK: MISC : 20.6%
    [IPU1-0] 37.939425 s:
    [IPU1-0] 37.939455 s: SYSTEM: SW Message Box Msg Pool, Free Msg Count = 1023
    [IPU1-0] 37.939547 s:
    [IPU1-0] 37.939577 s: SYSTEM: Sempahores Objects, 454 of 1050 free
    [IPU1-0] 37.939669 s: SYSTEM: Task Objects , 92 of 100 free
    [IPU1-0] 37.939760 s: SYSTEM: Clock Objects , 99 of 100 free
    [IPU1-0] 37.939882 s: SYSTEM: Hwi Objects , 97 of 100 free
    [IPU1-0] 37.939974 s:
    [IPU1-0] 37.940004 s: SYSTEM: Heap = LOCAL_L2 @ 0x40020000, Total size = 22528 B (22 KB), Free size = 8884 B (8 KB)
    [IPU1-0] 37.940157 s: SYSTEM: Heap = LOCAL_DDR @ 0x00000000, Total size = 262144 B (256 KB), Free size = 261008 B (254 KB)
    [IPU1-0] 37.940309 s:
    [IPU1-0] 37.940431 s:
    [IPU1-0] 37.940492 s: UTILS_PRCM_STATS: Current Temperature,
    [IPU1-0] 37.940553 s:
    [IPU1-0] 37.940584 s: Voltage Rail || Curr Temp Min - Max
    [IPU1-0] 37.940675 s: ---------------------------------------------------------
    [IPU1-0] 37.940767 s: PMHAL_PRCM_VD_CORE || [54.800 , 55.200]
    [IPU1-0] 37.940919 s:
    [IPU1-0] 37.941011 s:
    [IPU1-0] 37.941102 s: Statistics Collector,
    [IPU1-0] 37.941163 s:
    [IPU1-0] 37.941438 s: STATISTIC Avg Data Peak Data
    [IPU1-0] 37.941560 s: COLLECTOR MB/s MB/s
    [IPU1-0] 37.941621 s: --------------------------------------------------
    [IPU1-0] 37.941712 s: SCI_EMIF_SYS | 1254.557365 1933.027868
    [IPU1-0] 37.941865 s: SCI_IPU | 17.485756 40.127149
    [IPU1-0] 37.941987 s: SCI_DSP1_MDMA | 44.083301 68.864693
    [IPU1-0] 37.942109 s: SCI_DSP2_MDMA | 0.000000 0.000000
    [IPU1-0] 37.942231 s: SCI_DSS | 496.165083 521.401861
    [IPU1-0] 37.942383 s: SCI_MMU | 0.000000 0.000000
    [IPU1-0] 37.942505 s: SCI_EDMA_TC0_RD | 0.000000 0.000000
    [IPU1-0] 37.942658 s: SCI_EDMA_TC0_WR | 0.000000 0.000000
    [IPU1-0] 37.942993 s: SCI_VIP_P1 | 0.000000 0.000000
    [IPU1-0] 37.943146 s: SCI_VIP_P2 | 0.000000 0.000000
    [IPU1-0] 37.943298 s: SCI_ISS_RT | 43.800028 108.402303
    [IPU1-0] 37.943420 s: SCI_ISS_NRT2 | 0.000000 0.000000
    [IPU1-0] 37.943603 s: SCI_EVE_P1 | 142.627516 445.051541
    [IPU1-0] 37.943725 s: SCI_EVE_P2 | 66.198345 240.301919
    [IPU1-0] 37.943939 s: SCI_GMAC_SW | 0.000451 0.078857
    [IPU1-0] 37.944030 s: SCI_ISS_NRT1 | 0.000000 0.000000
    [IPU1-0] 37.944152 s: SCI_DSP2_CFG | 0.000000 0.000000
    [IPU1-0] 37.944244 s: SCI_DSP2_EDMA | 0.000000 0.000000
    [IPU1-0] 37.944335 s: SCI_OCMC_RAM | 0.000000 0.000000
    [IPU1-0] 37.944427 s: SCI_DSP1_CFG | 0.005242 0.024158
    [IPU1-0] 37.944549 s: SCI_DSP1_EDMA | 0.000000 0.000000
    [IPU1-0] 37.944641 s: SCI_GPMC | 0.000000 0.000000
    [IPU1-0] 37.944763 s: SCI_MCASP | 0.000000 0.000000
    [IPU1-0] 37.944885 s: SCI_EDMA_TC1_RD | 178.515518 418.024918
    [IPU1-0] 37.944976 s: SCI_EDMA_TC1_WR | 178.546407 418.024918
    [IPU1-0] 38.044836 s:
    [IPU1-0] 38.044927 s:
    [IPU1-0] 38.045019 s:
    [IPU1-0] 38.045080 s: ### CPU [IPU1-0], LinkID [ 81],
    [IPU1-0] 38.045141 s:
    [IPU1-0] 38.045202 s: [ ISSCAPTURE ] Link Statistics,
    [IPU1-0] 38.045263 s: ******************************
    [IPU1-0] 38.045324 s:
    [IPU1-0] 38.045354 s: Elapsed time = 23417 msec
    [IPU1-0] 38.045415 s:
    [IPU1-0] 38.045476 s: Get Full Buf Cb = 71.31 fps
    [IPU1-0] 38.045537 s: Put Empty Buf Cb = 71.1 fps
    [IPU1-0] 38.045629 s: Driver/Notify Cb = 83.31 fps
    [IPU1-0] 38.045690 s:
    [IPU1-0] 38.045751 s: Input Statistics,
    [IPU1-0] 38.045812 s:
    [IPU1-0] 38.045873 s: CH | In Recv | In Drop | In User Drop | In Process
    [IPU1-0] 38.045934 s: | FPS | FPS | FPS | FPS
    [IPU1-0] 38.046025 s: --------------------------------------------------
    [IPU1-0] 38.046117 s: 0 | 71.31 0. 0 0. 0 71.31
    [IPU1-0] 38.046239 s:
    [IPU1-0] 38.046269 s: Output Statistics,
    [IPU1-0] 38.046330 s:
    [IPU1-0] 38.046361 s: CH | Out | Out | Out Drop | Out User Drop
    [IPU1-0] 38.046452 s: | ID | FPS | FPS | FPS
    [IPU1-0] 38.046513 s: ---------------------------------------------
    [IPU1-0] 38.046605 s: 0 | 0 71.31 0. 0 0. 0
    [IPU1-0] 38.046818 s:
    [IPU1-0] 38.046849 s: [ ISSCAPTURE ] LATENCY,
    [IPU1-0] 38.046910 s: ********************
    [IPU1-0] 38.046971 s:
    [IPU1-0] 38.047093 s:
    [IPU1-0] 38.047123 s: ### CPU [IPU1-0], LinkID [ 0],
    [IPU1-0] 38.047215 s:
    [IPU1-0] 38.047245 s: [ IPC_OUT_0 ] Link Statistics,
    [IPU1-0] 38.047306 s: ******************************
    [IPU1-0] 38.047367 s:
    [IPU1-0] 38.047398 s: Elapsed time = 23419 msec
    [IPU1-0] 38.047489 s:
    [IPU1-0] 38.047520 s: New data Recv = 71.30 fps
    [IPU1-0] 38.047581 s: Release data Recv = 71.9 fps
    [IPU1-0] 38.047672 s: Driver/Notify Cb = 171.31 fps
    [IPU1-0] 38.047733 s:
    [IPU1-0] 38.047794 s: Input Statistics,
    [IPU1-0] 38.047977 s:
    [IPU1-0] 38.048038 s: CH | In Recv | In Drop | In User Drop | In Process
    [IPU1-0] 38.048099 s: | FPS | FPS | FPS | FPS
    [IPU1-0] 38.048191 s: --------------------------------------------------
    [IPU1-0] 38.048252 s: 0 | 71.30 0. 0 0. 0 71.30
    [IPU1-0] 38.048404 s:
    [IPU1-0] 38.048435 s: Output Statistics,
    [IPU1-0] 38.048496 s:
    [IPU1-0] 38.048526 s: CH | Out | Out | Out Drop | Out User Drop
    [IPU1-0] 38.048587 s: | ID | FPS | FPS | FPS
    [IPU1-0] 38.048679 s: ---------------------------------------------
    [IPU1-0] 38.048740 s: 0 | 0 71.30 0. 0 0. 0
    [IPU1-0] 38.048892 s:
    [IPU1-0] 38.048923 s: [ IPC_OUT_0 ] LATENCY,
    [IPU1-0] 38.048984 s: ********************
    [IPU1-0] 38.049045 s: Local Link Latency : Avg = 10 us, Min = 0 us, Max = 92 us,
    [IPU1-0] 38.049167 s: Source to Link Latency : Avg = 109 us, Min = 61 us, Max = 488 us,
    [IPU1-0] 38.049289 s:
    [IPU1-0] 38.548923 s:
    [IPU1-0] 38.549014 s: ### CPU [ DSP1], LinkID [ 10],
    [IPU1-0] 38.549075 s:
    [IPU1-0] 38.549136 s: [ IPC_IN_0 ] Link Statistics,
    [IPU1-0] 38.549289 s: ******************************
    [IPU1-0] 38.549350 s:
    [IPU1-0] 38.549380 s: Elapsed time = 23921 msec
    [IPU1-0] 38.549472 s:
    [IPU1-0] 38.549502 s: Get Full Buf Cb = 71.27 fps
    [IPU1-0] 38.549594 s: Put Empty Buf Cb = 71.31 fps
    [IPU1-0] 38.549655 s: Driver/Notify Cb = 71.27 fps
    [IPU1-0] 38.549746 s:
    [IPU1-0] 38.549777 s: Input Statistics,
    [IPU1-0] 38.549838 s:
    [IPU1-0] 38.549899 s: CH | In Recv | In Drop | In User Drop | In Process
    [IPU1-0] 38.549960 s: | FPS | FPS | FPS | FPS
    [IPU1-0] 38.550051 s: --------------------------------------------------
    [IPU1-0] 38.550143 s: 0 | 71.31 0. 0 0. 0 71.31
    [IPU1-0] 38.550265 s:
    [IPU1-0] 38.550295 s: Output Statistics,
    [IPU1-0] 38.550356 s:
    [IPU1-0] 38.550387 s: CH | Out | Out | Out Drop | Out User Drop
    [IPU1-0] 38.550478 s: | ID | FPS | FPS | FPS
    [IPU1-0] 38.550539 s: ---------------------------------------------
    [IPU1-0] 38.550631 s: 0 | 0 71.31 0. 0 0. 0
    [IPU1-0] 38.550753 s:
    [IPU1-0] 38.550783 s: [ IPC_IN_0 ] LATENCY,
    [IPU1-0] 38.550844 s: ********************
    [IPU1-0] 38.550905 s: Local Link Latency : Avg = 8 us, Min = 0 us, Max = 31 us,
    [IPU1-0] 38.551027 s: Source to Link Latency : Avg = 5219 us, Min = 183 us, Max = 54779 us,
    [IPU1-0] 38.551149 s:
    [IPU1-0] 38.551241 s:
    [IPU1-0] 38.551302 s: ### CPU [ DSP1], LinkID [ 49],
    [IPU1-0] 38.551363 s:
    [IPU1-0] 38.551424 s: [ ti.radar.fft ] Link Statistics,
    [IPU1-0] 38.551485 s: ******************************
    [IPU1-0] 38.551546 s:
    [IPU1-0] 38.551576 s: Elapsed time = 23923 msec
    [IPU1-0] 38.551637 s:
    [IPU1-0] 38.551698 s: New data Recv = 71.27 fps
    [IPU1-0] 38.551759 s:
    [IPU1-0] 38.551820 s: Input Statistics,
    [IPU1-0] 38.551881 s:
    [IPU1-0] 38.551912 s: CH | In Recv | In Drop | In User Drop | In Process
    [IPU1-0] 38.552003 s: | FPS | FPS | FPS | FPS
    [IPU1-0] 38.552064 s: --------------------------------------------------
    [IPU1-0] 38.552156 s: 0 | 71.31 11.91 0. 0 59.39
    [IPU1-0] 38.552278 s:
    [IPU1-0] 38.552339 s: Output Statistics,
    [IPU1-0] 38.552369 s:
    [IPU1-0] 38.552430 s: CH | Out | Out | Out Drop | Out User Drop
    [IPU1-0] 38.552491 s: | ID | FPS | FPS | FPS
    [IPU1-0] 38.552583 s: ---------------------------------------------
    [IPU1-0] 38.552644 s: 0 | 0 59.39 11.91 0. 0
    [IPU1-0] 38.552766 s:
    [IPU1-0] 38.552796 s: [ ti.radar.fft ] LATENCY,
    [IPU1-0] 38.552979 s: ********************
    [IPU1-0] 38.553071 s: Local Link Latency : Avg = 2371 us, Min = 2318 us, Max = 3264 us,
    [IPU1-0] 38.553162 s: Source to Link Latency : Avg = 8369 us, Min = 2562 us, Max = 57311 us,
    [IPU1-0] 38.553284 s:
    [IPU1-0] 38.553345 s: CPU [ DSP1], LinkID [ 25], Link Statistics not available !
    [IPU1-0] 38.553498 s:
    [IPU1-0] 38.553528 s: ### CPU [ DSP1], LinkID [ 51],
    [IPU1-0] 38.553620 s:
    [IPU1-0] 38.553650 s: [ ti.radar.drawfftheatmap ] Link Statistics,
    [IPU1-0] 38.553742 s: ******************************
    [IPU1-0] 38.553803 s:
    [IPU1-0] 38.553864 s: Elapsed time = 23921 msec
    [IPU1-0] 38.553955 s:
    [IPU1-0] 38.553986 s: New data Recv = 59.40 fps
    [IPU1-0] 38.554138 s:
    [IPU1-0] 38.554169 s: Input Statistics,
    [IPU1-0] 38.554230 s:
    [IPU1-0] 38.554260 s: CH | In Recv | In Drop | In User Drop | In Process
    [IPU1-0] 38.554352 s: | FPS | FPS | FPS | FPS
    [IPU1-0] 38.554413 s: --------------------------------------------------
    [IPU1-0] 38.554504 s: 0 | 59.40 0. 0 0. 0 59.40
    [IPU1-0] 38.554626 s:
    [IPU1-0] 38.554687 s: Output Statistics,
    [IPU1-0] 38.554718 s:
    [IPU1-0] 38.554779 s: CH | Out | Out | Out Drop | Out User Drop
    [IPU1-0] 38.554870 s: | ID | FPS | FPS | FPS
    [IPU1-0] 38.554931 s: ---------------------------------------------
    [IPU1-0] 38.555023 s: 0 | 0 59.40 0. 0 0. 0
    [IPU1-0] 38.555145 s:
    [IPU1-0] 38.555175 s: [ ti.radar.drawfftheatmap ] LATENCY,
    [IPU1-0] 38.555267 s: ********************
    [IPU1-0] 38.555297 s: Local Link Latency : Avg = 10745 us, Min = 10279 us, Max = 62496 us,
    [IPU1-0] 38.555419 s: Source to Link Latency : Avg = 20612 us, Min = 14670 us, Max = 69054 us,
    [IPU1-0] 38.555541 s:
    [IPU1-0] 38.555664 s:
    [IPU1-0] 38.555694 s: ### CPU [ DSP1], LinkID [ 1],
    [IPU1-0] 38.555755 s:
    [IPU1-0] 38.555816 s: [ IPC_OUT_1 ] Link Statistics,
    [IPU1-0] 38.555908 s: ******************************
    [IPU1-0] 38.555969 s:
    [IPU1-0] 38.555999 s: Elapsed time = 23860 msec
    [IPU1-0] 38.556060 s:
    [IPU1-0] 38.556091 s: New data Recv = 59.55 fps
    [IPU1-0] 38.556182 s: Release data Recv = 59.72 fps
    [IPU1-0] 38.556243 s: Driver/Notify Cb = 159.47 fps
    [IPU1-0] 38.556335 s:
    [IPU1-0] 38.556365 s: Input Statistics,
    [IPU1-0] 38.556426 s:
    [IPU1-0] 38.556457 s: CH | In Recv | In Drop | In User Drop | In Process
    [IPU1-0] 38.556548 s: | FPS | FPS | FPS | FPS
    [IPU1-0] 38.556609 s: --------------------------------------------------
    [IPU1-0] 38.556701 s: 0 | 59.55 0. 0 0. 0 59.55
    [IPU1-0] 38.556853 s:
    [IPU1-0] 38.556884 s: Output Statistics,
    [IPU1-0] 38.556945 s:
    [IPU1-0] 38.556975 s: CH | Out | Out | Out Drop | Out User Drop
    [IPU1-0] 38.557067 s: | ID | FPS | FPS | FPS
    [IPU1-0] 38.557128 s: ---------------------------------------------
    [IPU1-0] 38.557219 s: 0 | 0 59.55 0. 0 0. 0
    [IPU1-0] 38.557311 s:
    [IPU1-0] 38.557372 s: [ IPC_OUT_1 ] LATENCY,
    [IPU1-0] 38.557433 s: ********************
    [IPU1-0] 38.557463 s: Local Link Latency : Avg = 3 us, Min = 0 us, Max = 31 us,
    [IPU1-0] 38.558378 s: Source to Link Latency : Avg = 20785 us, Min = 14793 us, Max = 69176 us,
    [IPU1-0] 38.558531 s:
    [IPU1-0] 39.058348 s:
    [IPU1-0] 39.058439 s: ### CPU [IPU1-0], LinkID [ 10],
    [IPU1-0] 39.058500 s:
    [IPU1-0] 39.058561 s: [ IPC_IN_0 ] Link Statistics,
    [IPU1-0] 39.058622 s: ******************************
    [IPU1-0] 39.058683 s:
    [IPU1-0] 39.058714 s: Elapsed time = 24363 msec
    [IPU1-0] 39.058775 s:
    [IPU1-0] 39.058866 s: Get Full Buf Cb = 59.55 fps
    [IPU1-0] 39.058958 s: Put Empty Buf Cb = 59.47 fps
    [IPU1-0] 39.059019 s: Driver/Notify Cb = 59.51 fps
    [IPU1-0] 39.059110 s:
    [IPU1-0] 39.059141 s: Input Statistics,
    [IPU1-0] 39.059202 s:
    [IPU1-0] 39.059232 s: CH | In Recv | In Drop | In User Drop | In Process
    [IPU1-0] 39.059293 s: | FPS | FPS | FPS | FPS
    [IPU1-0] 39.059385 s: --------------------------------------------------
    [IPU1-0] 39.059476 s: 0 | 59.55 0. 0 0. 0 59.55
    [IPU1-0] 39.059598 s:
    [IPU1-0] 39.059629 s: Output Statistics,
    [IPU1-0] 39.059690 s:
    [IPU1-0] 39.059720 s: CH | Out | Out | Out Drop | Out User Drop
    [IPU1-0] 39.059812 s: | ID | FPS | FPS | FPS
    [IPU1-0] 39.059903 s: ---------------------------------------------
    [IPU1-0] 39.059964 s: 0 | 0 59.55 0. 0 0. 0
    [IPU1-0] 39.060086 s:
    [IPU1-0] 39.060147 s: [ IPC_IN_0 ] LATENCY,
    [IPU1-0] 39.060208 s: ********************
    [IPU1-0] 39.060239 s: Local Link Latency : Avg = 24 us, Min = 0 us, Max = 214 us,
    [IPU1-0] 39.060361 s: Source to Link Latency : Avg = 20968 us, Min = 14945 us, Max = 69328 us,
    [IPU1-0] 39.060483 s:
    [IPU1-0] 39.060605 s:
    [IPU1-0] 39.060635 s: ### CPU [IPU1-0], LinkID [ 71],
    [IPU1-0] 39.060696 s:
    [IPU1-0] 39.060757 s: [ DISPLAY ] Link Statistics,
    [IPU1-0] 39.060818 s: ******************************
    [IPU1-0] 39.060910 s:
    [IPU1-0] 39.060940 s: Elapsed time = 24365 msec
    [IPU1-0] 39.061001 s:
    [IPU1-0] 39.061062 s: New data Recv = 59.51 fps
    [IPU1-0] 39.061123 s: Driver/Notify Cb = 60.0 fps
    [IPU1-0] 39.061184 s:
    [IPU1-0] 39.061245 s: Input Statistics,
    [IPU1-0] 39.061276 s:
    [IPU1-0] 39.061337 s: CH | In Recv | In Drop | In User Drop | In Process
    [IPU1-0] 39.061398 s: | FPS | FPS | FPS | FPS
    [IPU1-0] 39.061489 s: --------------------------------------------------
    [IPU1-0] 39.062008 s: 0 | 59.55 0. 0 0. 0 59.55
    [IPU1-0] 39.062160 s:
    [IPU1-0] 39.062221 s: [ DISPLAY ] LATENCY,
    [IPU1-0] 39.062252 s: ********************
    [IPU1-0] 39.062313 s: Local Link Latency : Avg = 99 us, Min = 30 us, Max = 854 us,
    [IPU1-0] 39.062465 s: Source to Link Latency : Avg = 21257 us, Min = 15128 us, Max = 69664 us,
    [IPU1-0] 39.062587 s:
    [IPU1-0] 39.062648 s: Display UnderFlow Count = 0
    [IPU1-0] 39.062709 s:
    [IPU1-0] 39.561916 s:
    [IPU1-0] 39.561977 s: ### CPU [ DSP1], LinkID [ 50],
    [IPU1-0] 39.562069 s:
    [IPU1-0] 39.562099 s: [ ti.radar.pkDetect ] Link Statistics,
    [IPU1-0] 39.562191 s: ******************************
    [IPU1-0] 39.562252 s:
    [IPU1-0] 39.562282 s: Elapsed time = 24931 msec
    [IPU1-0] 39.562374 s:
    [IPU1-0] 39.562404 s: New data Recv = 59.40 fps
    [IPU1-0] 39.562496 s:
    [IPU1-0] 39.562526 s: Input Statistics,
    [IPU1-0] 39.562587 s:
    [IPU1-0] 39.562618 s: CH | In Recv | In Drop | In User Drop | In Process
    [IPU1-0] 39.562679 s: | FPS | FPS | FPS | FPS
    [IPU1-0] 39.562770 s: --------------------------------------------------
    [IPU1-0] 39.562862 s: 0 | 59.40 0. 0 0. 0 59.40
    [IPU1-0] 39.563014 s:
    [IPU1-0] 39.563045 s: Output Statistics,
    [IPU1-0] 39.563106 s:
    [IPU1-0] 39.563136 s: CH | Out | Out | Out Drop | Out User Drop
    [IPU1-0] 39.563228 s: | ID | FPS | FPS | FPS
    [IPU1-0] 39.563289 s: ---------------------------------------------
    [IPU1-0] 39.563380 s: 0 | 0 59.40 0. 0 0. 0
    [IPU1-0] 39.563472 s:
    [IPU1-0] 39.563533 s: [ ti.radar.pkDetect ] LATENCY,
    [IPU1-0] 39.563594 s: ********************
    [IPU1-0] 39.563655 s: Local Link Latency : Avg = 1284 us, Min = 1190 us, Max = 2104 us,
    [IPU1-0] 39.563777 s: Source to Link Latency : Avg = 9810 us, Min = 3995 us, Max = 58714 us,
    [IPU1-0] 39.563899 s:
    [IPU1-0] 39.563960 s: CPU [ DSP1], LinkID [ 38], Link Statistics not available !
    [IPU1-0] 39.564112 s:
    [IPU1-0] 39.564173 s: ### CPU [ DSP1], LinkID [ 34],
    [IPU1-0] 39.564234 s:
    [IPU1-0] 39.564265 s: [ SYNC_0 ] Link Statistics,
    [IPU1-0] 39.564326 s: ******************************
    [IPU1-0] 39.564387 s:
    [IPU1-0] 39.564448 s: Elapsed time = 25099 msec
    [IPU1-0] 39.564509 s:
    [IPU1-0] 39.564539 s: New data Recv = 126.77 fps
    [IPU1-0] 39.564631 s: Get Full Buf Cb = 59.0 fps
    [IPU1-0] 39.564692 s: Put Empty Buf Cb = 58.96 fps
    [IPU1-0] 39.564783 s: Driver/Notify Cb = 30.28 fps
    [IPU1-0] 39.564966 s:
    [IPU1-0] 39.564997 s: Input Statistics,
    [IPU1-0] 39.565149 s:
    [IPU1-0] 39.565210 s: CH | In Recv | In Drop | In User Drop | In Process
    [IPU1-0] 39.565271 s: | FPS | FPS | FPS | FPS
    [IPU1-0] 39.565363 s: --------------------------------------------------
    [IPU1-0] 39.565454 s: 0 | 59. 0 0. 0 0. 0 59. 0
    [IPU1-0] 39.565576 s: 1 | 59. 0 0. 0 0. 0 59. 0
    [IPU1-0] 39.566125 s:
    [IPU1-0] 39.566186 s: Output Statistics,
    [IPU1-0] 39.566247 s:
    [IPU1-0] 39.566278 s: CH | Out | Out | Out Drop | Out User Drop
    [IPU1-0] 39.566339 s: | ID | FPS | FPS | FPS
    [IPU1-0] 39.566430 s: ---------------------------------------------
    [IPU1-0] 39.566522 s: 0 | 0 59. 0 0. 0 0. 0
    [IPU1-0] 39.566644 s:
    [IPU1-0] 39.566674 s: [ SYNC_0 ] LATENCY,
    [IPU1-0] 39.566766 s: ********************
    [IPU1-0] 39.566827 s: Local Link Latency : Avg = 6164 us, Min = 0 us, Max = 64052 us,
    [IPU1-0] 39.567040 s: Source to Link Latency : Avg = 20814 us, Min = 14793 us, Max = 69237 us,
    [IPU1-0] 39.567193 s:
    [IPU1-0] 39.567345 s:
    [IPU1-0] 39.567376 s: ### CPU [ DSP1], LinkID [ 0],
    [IPU1-0] 39.567467 s:
    [IPU1-0] 39.567498 s: [ IPC_OUT_0 ] Link Statistics,
    [IPU1-0] 39.567559 s: ******************************
    [IPU1-0] 39.567650 s:
    [IPU1-0] 39.567681 s: Elapsed time = 24872 msec
    [IPU1-0] 39.567772 s:
    [IPU1-0] 39.567803 s: New data Recv = 59.54 fps
    [IPU1-0] 39.567925 s: Release data Recv = 59.58 fps
    [IPU1-0] 39.568016 s: Driver/Notify Cb = 159.53 fps
    [IPU1-0] 39.568108 s:
    [IPU1-0] 39.568169 s: Input Statistics,
    [IPU1-0] 39.568199 s:
    [IPU1-0] 39.568260 s: CH | In Recv | In Drop | In User Drop | In Process
    [IPU1-0] 39.568352 s: | FPS | FPS | FPS | FPS
    [IPU1-0] 39.568443 s: --------------------------------------------------
    [IPU1-0] 39.568535 s: 0 | 59.54 0. 0 0. 0 59.54
    [IPU1-0] 39.568809 s:
    [IPU1-0] 39.568901 s: Output Statistics,
    [IPU1-0] 39.568962 s:
    [IPU1-0] 39.569023 s: CH | Out | Out | Out Drop | Out User Drop
    [IPU1-0] 39.569114 s: | ID | FPS | FPS | FPS
    [IPU1-0] 39.569206 s: ---------------------------------------------
    [IPU1-0] 39.569297 s: 0 | 0 59.54 0. 0 0. 0
    [IPU1-0] 39.569419 s:
    [IPU1-0] 39.569450 s: [ IPC_OUT_0 ] LATENCY,
    [IPU1-0] 39.569511 s: ********************
    [IPU1-0] 39.569572 s: Local Link Latency : Avg = 3 us, Min = 0 us, Max = 31 us,
    [IPU1-0] 39.569694 s: Source to Link Latency : Avg = 20870 us, Min = 14915 us, Max = 69267 us,
    [IPU1-0] 39.569816 s:
    [IPU1-0] 40.070243 s:
    [IPU1-0] 40.070304 s: ### CPU [IPU1-1], LinkID [ 10],
    [IPU1-0] 40.070395 s:
    [IPU1-0] 40.070426 s: [ IPC_IN_0 ] Link Statistics,
    [IPU1-0] 40.070517 s: ******************************
    [IPU1-0] 40.070578 s:
    [IPU1-0] 40.070639 s: Elapsed time = 25375 msec
    [IPU1-0] 40.070700 s:
    [IPU1-0] 40.070761 s: Get Full Buf Cb = 59.54 fps
    [IPU1-0] 40.070853 s: Put Empty Buf Cb = 59.54 fps
    [IPU1-0] 40.071097 s: Driver/Notify Cb = 59.50 fps
    [IPU1-0] 40.071188 s:
    [IPU1-0] 40.071249 s: Input Statistics,
    [IPU1-0] 40.071280 s:
    [IPU1-0] 40.071341 s: CH | In Recv | In Drop | In User Drop | In Process
    [IPU1-0] 40.071402 s: | FPS | FPS | FPS | FPS
    [IPU1-0] 40.071493 s: --------------------------------------------------
    [IPU1-0] 40.071585 s: 0 | 59.54 0. 0 0. 0 59.54
    [IPU1-0] 40.071737 s:
    [IPU1-0] 40.071768 s: Output Statistics,
    [IPU1-0] 40.071829 s:
    [IPU1-0] 40.071890 s: CH | Out | Out | Out Drop | Out User Drop
    [IPU1-0] 40.072012 s: | ID | FPS | FPS | FPS
    [IPU1-0] 40.072073 s: ---------------------------------------------
    [IPU1-0] 40.072164 s: 0 | 0 59.54 0. 0 0. 0
    [IPU1-0] 40.072286 s:
    [IPU1-0] 40.072347 s: [ IPC_IN_0 ] LATENCY,
    [IPU1-0] 40.072408 s: ********************
    [IPU1-0] 40.072469 s: Local Link Latency : Avg = 34 us, Min = 30 us, Max = 92 us,
    [IPU1-0] 40.072744 s: Source to Link Latency : Avg = 21075 us, Min = 15098 us, Max = 69450 us,
    [IPU1-0] 40.072927 s:
    [IPU1-0] 40.073110 s:
    [IPU1-0] 40.073140 s: ### CPU [IPU1-1], LinkID [ 63],
    [IPU1-0] 40.073232 s:
    [IPU1-0] 40.073293 s: [ NETWORK TX ] Link Statistics,
    [IPU1-0] 40.073354 s: ******************************
    [IPU1-0] 40.073415 s:
    [IPU1-0] 40.073445 s: Elapsed time = 25378 msec
    [IPU1-0] 40.073506 s:
    [IPU1-0] 40.073567 s: New data Recv = 59.50 fps
    [IPU1-0] 40.073628 s:
    [IPU1-0] 40.073689 s: Input Statistics,
    [IPU1-0] 40.073720 s:
    [IPU1-0] 40.073781 s: CH | In Recv | In Drop | In User Drop | In Process
    [IPU1-0] 40.073872 s: | FPS | FPS | FPS | FPS
    [IPU1-0] 40.073964 s: --------------------------------------------------
    [IPU1-0] 40.074025 s: 0 | 59.53 0. 0 0. 0 59.53
    [IPU1-0] 40.074208 s:
    [IPU1-0] 40.074269 s: [ NETWORK TX ] LATENCY,
    [IPU1-0] 40.074361 s: ********************
    [IPU1-0] 40.074422 s: Local Link Latency : Avg = 168 us, Min = 122 us, Max = 823 us,
    [IPU1-0] 40.075215 s: Source to Link Latency : Avg = 21208 us, Min = 15220 us, Max = 69572 us,
    [IPU1-0] 40.075428 s:
    [IPU1-0] 40.575093 s: CPU [ IPU1-0], LinkID [ 23], Link Statistics not available !
    [IPU1-0] 40.575306 s:
    [IPU1-0] 40.575337 s: ### CPU [IPU1-0], LinkID [ 72],
    [IPU1-0] 40.575428 s:
    [IPU1-0] 40.575459 s: [ DISPLAY ] Link Statistics,
    [IPU1-0] 40.575550 s: ******************************
    [IPU1-0] 40.575611 s:
    [IPU1-0] 40.575642 s: Elapsed time = 26143 msec
    [IPU1-0] 40.575733 s:
    [IPU1-0] 40.575764 s: Driver/Notify Cb = 60.1 fps
    [IPU1-0] 40.575916 s:
    [IPU1-0] 40.575947 s: Input Statistics,
    [IPU1-0] 40.576008 s:
    [IPU1-0] 40.576069 s: CH | In Recv | In Drop | In User Drop | In Process
    [IPU1-0] 40.576160 s: | FPS | FPS | FPS | FPS
    [IPU1-0] 40.576252 s: --------------------------------------------------
    [IPU1-0] 40.576343 s: 0 | 0. 3 0. 0 0. 0 0. 3
    [IPU1-0] 40.576465 s:
    [IPU1-0] 40.576496 s: [ DISPLAY ] LATENCY,
    [IPU1-0] 40.576740 s: ********************
    [IPU1-0] 40.576801 s: Local Link Latency : Avg = 61 us, Min = 61 us, Max = 61 us,
    [IPU1-0] 40.576984 s: Source to Link Latency : Avg = 19551 us, Min = 19551 us, Max = 19551 us,
    [IPU1-0] 40.577106 s:
    [IPU1-0] 40.577167 s: Display UnderFlow Count = 0
    [IPU1-0] 40.577228 s:
    [IPU1-0] 41.076892 s:
    [IPU1-0]
    [IPU1-0] ====================
    [IPU1-0] Chains Run-time Menu
    [IPU1-0] ====================
    [IPU1-0]
    [IPU1-0] 0: Stop Chain
    [IPU1-0]
    [IPU1-0] c: Read-back and Check AR params
    [IPU1-0]
    [IPU1-0] d: Dynamically change params
    [IPU1-0]
    [IPU1-0] p: Print Performance Statistics
    [IPU1-0]
    [IPU1-0] Enter Choice:
    [IPU1-0]

  • Thanks for the full logs!

    The 60 FPS limit is getting set by the display link. The display is always refreshed at 60 FPS. Can you please share your usecase flow?

    Thanks and Regards,
    Piyali
  • Hi Piyali,

    Not sure what you would like to know. The use case performs RDM + PeakDetect with HDMI display and Ethernet out setup to output RDM + Detection List. But I didn't request Ethernet data while capturing the above performance stats.

    Regards,

    --Khai

  • Hi Khai,

    I am looking for the usecase *.txt file that you had used to generate the usecase. The rate is determined by the Display rate (not network). The display is running at 60 FPS. This is what is holding the buffers in your case. Since the display is holding the buffers the rest of the links before the display are also running at ~60 FPS. Display is set at the rate at which the HDMI TV can play this. So you would need to continue to run the display link at 60 FPS.

    Thanks and Regards,
    Piyali
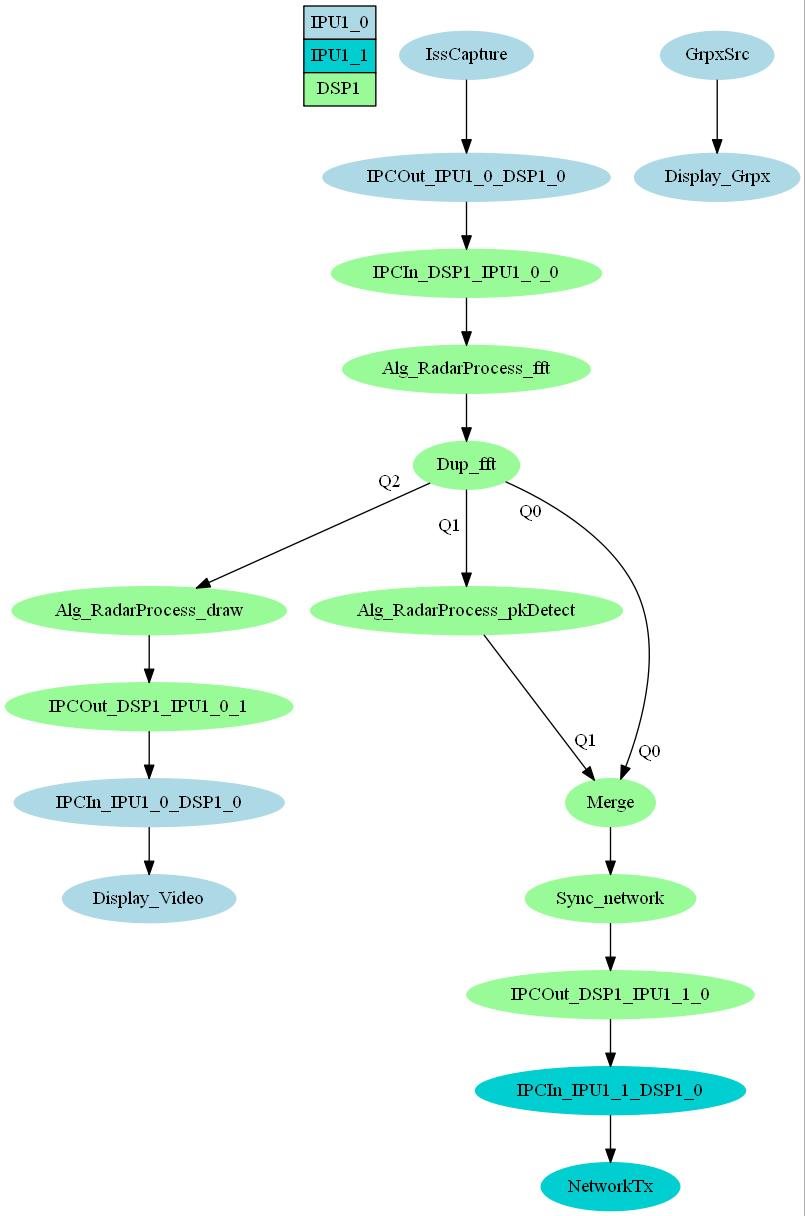
  • chains_radar_MetawaveRdmPeakDetect.txt
    UseCase: chains_radar_MetawaveRdmPeakDetect
    
    IssCapture -> Alg_RadarProcess_fft (DSP1) -> Dup_fft (DSP1)
    
    Dup_fft (DSP1) -> Merge (DSP1)
    Dup_fft (DSP1) -> Alg_RadarProcess_pkDetect (DSP1) -> Merge (DSP1) -> Sync_network (DSP1) -> NetworkTx (IPU1_1)
    Dup_fft (DSP1) -> Alg_RadarProcess_draw (DSP1) -> Display_Video
    
    GrpxSrc -> Display_Grpx


  • Hi Piyali,

    Based on your analysis, I rerun 64 chirps on this use case where I set the framePeriodicity = 12ms. The captured stats below. As you said, the display is capped at 60Hz but the rest of the links were able to keep up with the frame rate of 83.
    Thanks,
    --Khai

    [IPU1-0] 125.810315 s: CPU [IPU1-0 ] Statistics,
    [IPU1-0] 125.810376 s: *************************
    [IPU1-0] 125.810437 s:
    [IPU1-0] 125.810498 s: LOAD: CPU: 13.7% HWI: 3.9%, SWI:0.8%, Low Power: 0.0%
    [IPU1-0] 125.810925 s:
    [IPU1-0] 125.810986 s: LOAD: TSK: IPC_IN_0 : 0.8%
    [IPU1-0] 125.811077 s: LOAD: TSK: IPC_OUT_0 : 1.8%
    [IPU1-0] 125.811413 s: LOAD: TSK: DISPLAY0 : 1.3%
    [IPU1-0] 125.811535 s: LOAD: TSK: ISSCAPTURE : 0.8%
    [IPU1-0] 125.811626 s: LOAD: TSK: GrpxSrc0 : 0.3%
    [IPU1-0] 125.811718 s: LOAD: TSK: STAT_COLL : 2.8%
    [IPU1-0] 125.811809 s: LOAD: TSK: MISC : 1.2%
    [IPU1-0] 125.811901 s:
    [IPU1-0] 125.811931 s: SYSTEM: SW Message Box Msg Pool, Free Msg Count = 1022
    [IPU1-0] 125.812023 s:
    [IPU1-0] 125.812084 s: SYSTEM: Sempahores Objects, 268 of 1050 free
    [IPU1-0] 125.812175 s: SYSTEM: Task Objects , 24 of 100 free
    [IPU1-0] 125.812267 s: SYSTEM: Clock Objects , 96 of 100 free
    [IPU1-0] 125.812358 s: SYSTEM: Hwi Objects , 84 of 100 free
    [IPU1-0] 125.812450 s:
    [IPU1-0] 125.812511 s: SYSTEM: Heap = LOCAL_DDR @ 0x00000000, Total size = 262144 B (256 KB), Free size = 258624 B (252 KB)
    [IPU1-0] 125.812663 s: SYSTEM: Heap = SR_OCMC @ 0x00000000, Total size = 0 B (0 KB), Free size = 0 B (0 KB)
    [IPU1-0] 125.812816 s: SYSTEM: Heap = SR_DDR_CACHED @ 0x85703000, Total size = 369086464 B (351 MB), Free size = 329703424 B (314 MB)
    [IPU1-0] 125.812968 s: SYSTEM: Heap = SR_DDR_NON_CACHED @ 0x00000000, Total size = 0 B (0 MB), Free size = 0 B (0 MB)
    [IPU1-0] 125.813121 s:
    [IPU1-0] 125.813182 s:
    [IPU1-0] 125.813243 s: CPU [IPU1-1 ] Statistics,
    [IPU1-0] 125.813304 s: *************************
    [IPU1-0] 125.813365 s:
    [IPU1-0] 125.813426 s: LOAD: CPU: 5.9% HWI: 1.4%, SWI:0.5%, Low Power: 0.0%
    [IPU1-0] 125.813548 s:
    [IPU1-0] 125.813609 s: LOAD: TSK: IPC_IN_0 : 1.3%
    [IPU1-0] 125.813731 s: LOAD: TSK: NETWORK TX0 : 1.9%
    [IPU1-0] 125.813853 s: LOAD: TSK: MISC : 0.8%
    [IPU1-0] 125.813944 s:
    [IPU1-0] 125.813975 s: SYSTEM: SW Message Box Msg Pool, Free Msg Count = 1022
    [IPU1-0] 125.814066 s:
    [IPU1-0] 125.814097 s: SYSTEM: Sempahores Objects, 428 of 1050 free
    [IPU1-0] 125.814219 s: SYSTEM: Task Objects , 36 of 100 free
    [IPU1-0] 125.814310 s: SYSTEM: Clock Objects , 99 of 100 free
    [IPU1-0] 125.814402 s: SYSTEM: Hwi Objects , 97 of 100 free
    [IPU1-0] 125.814493 s:
    [IPU1-0] 125.814524 s: SYSTEM: Heap = LOCAL_DDR @ 0x00000000, Total size = 262144 B (256 KB), Free size = 246224 B (240 KB)
    [IPU1-0] 125.814707 s:
    [IPU1-0] 125.814737 s:
    [IPU1-0] 125.814768 s: CPU [DSP1 ] Statistics,
    [IPU1-0] 125.814829 s: *************************
    [IPU1-0] 125.814890 s:
    [IPU1-0] 125.814951 s: LOAD: CPU: 34.1% HWI: 1.3%, SWI:0.3%, Low Power: 0.0%
    [IPU1-0] 125.815104 s:
    [IPU1-0] 125.815134 s: LOAD: TSK: MISC : 32.5%
    [IPU1-0] 125.815256 s:
    [IPU1-0] 125.815317 s: SYSTEM: SW Message Box Msg Pool, Free Msg Count = 1022
    [IPU1-0] 125.815409 s:
    [IPU1-0] 125.815470 s: SYSTEM: Sempahores Objects, 442 of 1050 free
    [IPU1-0] 125.815561 s: SYSTEM: Task Objects , 91 of 100 free
    [IPU1-0] 125.815622 s: SYSTEM: Clock Objects , 96 of 100 free
    [IPU1-0] 125.815714 s: SYSTEM: Hwi Objects , 98 of 100 free
    [IPU1-0] 125.815805 s:
    [IPU1-0] 125.815866 s: SYSTEM: Heap = LOCAL_L2 @ 0x00800000, Total size = 227264 B (221 KB), Free size = 227264 B (221 KB)
    [IPU1-0] 125.816019 s: SYSTEM: Heap = LOCAL_DDR @ 0x00000000, Total size = 524288 B (512 KB), Free size = 457160 B (446 KB)
    [IPU1-0] 125.816354 s:
    [IPU1-0] 125.816415 s:
    [IPU1-0] 125.816446 s: CPU [EVE1 ] Statistics,
    [IPU1-0] 125.816507 s: *************************
    [IPU1-0] 125.816568 s:
    [IPU1-0] 125.816629 s: LOAD: CPU: 20.9% HWI: 1.8%, SWI:0.2%, Low Power: 0.0%
    [IPU1-0] 125.816781 s:
    [IPU1-0] 125.816842 s: LOAD: TSK: MISC : 18.9%
    [IPU1-0] 125.816903 s:
    [IPU1-0] 125.816964 s: SYSTEM: SW Message Box Msg Pool, Free Msg Count = 1022
    [IPU1-0] 125.817056 s:
    [IPU1-0] 125.817086 s: SYSTEM: Sempahores Objects, 454 of 1050 free
    [IPU1-0] 125.817178 s: SYSTEM: Task Objects , 92 of 100 free
    [IPU1-0] 125.817300 s: SYSTEM: Clock Objects , 99 of 100 free
    [IPU1-0] 125.817391 s: SYSTEM: Hwi Objects , 97 of 100 free
    [IPU1-0] 125.817483 s:
    [IPU1-0] 125.817513 s: SYSTEM: Heap = LOCAL_L2 @ 0x40020000, Total size = 22528 B (22 KB), Free size = 8884 B (8 KB)
    [IPU1-0] 125.817666 s: SYSTEM: Heap = LOCAL_DDR @ 0x00000000, Total size = 262144 B (256 KB), Free size = 261008 B (254 KB)
    [IPU1-0] 125.817849 s:
    [IPU1-0] 125.818215 s:
    [IPU1-0] 125.818672 s: UTILS_PRCM_STATS: Current Temperature,
    [IPU1-0] 125.818764 s:
    [IPU1-0] 125.818794 s: Voltage Rail || Curr Temp Min - Max
    [IPU1-0] 125.818886 s: ---------------------------------------------------------
    [IPU1-0] 125.818977 s: PMHAL_PRCM_VD_CORE || [55.200 , 55.600]
    [IPU1-0] 125.819099 s:
    [IPU1-0] 126.817330 s:
    [IPU1-0] 126.817391 s: Statistics Collector,
    [IPU1-0] 126.817452 s:
    [IPU1-0] 126.817513 s: STATISTIC Avg Data Peak Data
    [IPU1-0] 126.817635 s: COLLECTOR MB/s MB/s
    [IPU1-0] 126.817727 s: --------------------------------------------------
    [IPU1-0] 126.817879 s: SCI_EMIF_SYS | 1199.316777 1756.136814
    [IPU1-0] 126.818032 s: SCI_IPU | 19.641376 48.044782
    [IPU1-0] 126.818184 s: SCI_DSP1_MDMA | 45.644759 88.410235
    [IPU1-0] 126.818367 s: SCI_DSP2_MDMA | 0.000000 0.000000
    [IPU1-0] 126.818520 s: SCI_DSS | 496.237744 521.170613
    [IPU1-0] 126.818672 s: SCI_MMU | 0.000000 0.000000
    [IPU1-0] 126.818794 s: SCI_EDMA_TC0_RD | 0.000000 0.000000
    [IPU1-0] 126.818947 s: SCI_EDMA_TC0_WR | 0.000000 0.000000
    [IPU1-0] 126.819069 s: SCI_VIP_P1 | 0.000000 0.000000
    [IPU1-0] 126.819252 s: SCI_VIP_P2 | 0.000000 0.000000
    [IPU1-0] 126.819343 s: SCI_ISS_RT | 21.901239 56.028954
    [IPU1-0] 126.819465 s: SCI_ISS_NRT2 | 0.000000 0.000000
    [IPU1-0] 126.819557 s: SCI_EVE_P1 | 120.441735 276.178837
    [IPU1-0] 126.819679 s: SCI_EVE_P2 | 46.383565 118.637428
    [IPU1-0] 126.819770 s: SCI_GMAC_SW | 0.000000 0.000000
    [IPU1-0] 126.819892 s: SCI_ISS_NRT1 | 0.000000 0.000000
    [IPU1-0] 126.819984 s: SCI_DSP2_CFG | 0.000000 0.000000
    [IPU1-0] 126.820075 s: SCI_DSP2_EDMA | 0.000000 0.000000
    [IPU1-0] 126.820197 s: SCI_OCMC_RAM | 0.000000 0.000000
    [IPU1-0] 126.820319 s: SCI_DSP1_CFG | 0.009305 0.024158
    [IPU1-0] 126.820411 s: SCI_DSP1_EDMA | 0.000000 0.000000
    [IPU1-0] 126.820533 s: SCI_GPMC | 0.000000 0.000000
    [IPU1-0] 126.820624 s: SCI_MCASP | 0.000000 0.000000
    [IPU1-0] 126.820746 s: SCI_EDMA_TC1_RD | 229.112210 467.023847
    [IPU1-0] 126.820838 s: SCI_EDMA_TC1_WR | 229.153436 467.379968
    [IPU1-0] 127.009241 s:
    [IPU1-0] 127.009333 s:
    [IPU1-0] 127.009424 s:
    [IPU1-0] 127.009485 s: ### CPU [IPU1-0], LinkID [ 81],
    [IPU1-0] 127.009546 s:
    [IPU1-0] 127.009607 s: [ ISSCAPTURE ] Link Statistics,
    [IPU1-0] 127.009668 s: ******************************
    [IPU1-0] 127.009729 s:
    [IPU1-0] 127.009790 s: Elapsed time = 83192 msec
    [IPU1-0] 127.009882 s:
    [IPU1-0] 127.009912 s: Get Full Buf Cb = 83.33 fps
    [IPU1-0] 127.010004 s: Put Empty Buf Cb = 83.33 fps
    [IPU1-0] 127.010065 s: Driver/Notify Cb = 83.32 fps
    [IPU1-0] 127.010156 s:
    [IPU1-0] 127.010187 s: Input Statistics,
    [IPU1-0] 127.010278 s:
    [IPU1-0] 127.010339 s: CH | In Recv | In Drop | In User Drop | In Process
    [IPU1-0] 127.010400 s: | FPS | FPS | FPS | FPS
    [IPU1-0] 127.010492 s: --------------------------------------------------
    [IPU1-0] 127.010614 s: 0 | 83.33 0. 0 0. 0 83.33
    [IPU1-0] 127.011010 s:
    [IPU1-0] 127.011071 s: Output Statistics,
    [IPU1-0] 127.011132 s:
    [IPU1-0] 127.011163 s: CH | Out | Out | Out Drop | Out User Drop
    [IPU1-0] 127.011437 s: | ID | FPS | FPS | FPS
    [IPU1-0] 127.011529 s: ---------------------------------------------
    [IPU1-0] 127.011590 s: 0 | 0 83.33 0. 0 0. 0
    [IPU1-0] 127.011712 s:
    [IPU1-0] 127.011773 s: [ ISSCAPTURE ] LATENCY,
    [IPU1-0] 127.011834 s: ********************
    [IPU1-0] 127.011895 s:
    [IPU1-0] 127.011986 s:
    [IPU1-0] 127.012017 s: ### CPU [IPU1-0], LinkID [ 0],
    [IPU1-0] 127.012108 s:
    [IPU1-0] 127.012139 s: [ IPC_OUT_0 ] Link Statistics,
    [IPU1-0] 127.012261 s: ******************************
    [IPU1-0] 127.012322 s:
    [IPU1-0] 127.012352 s: Elapsed time = 83195 msec
    [IPU1-0] 127.012444 s:
    [IPU1-0] 127.012474 s: New data Recv = 83.33 fps
    [IPU1-0] 127.012535 s: Release data Recv = 83.46 fps
    [IPU1-0] 127.012627 s: Driver/Notify Cb = 183.32 fps
    [IPU1-0] 127.012718 s:
    [IPU1-0] 127.012749 s: Input Statistics,
    [IPU1-0] 127.012810 s:
    [IPU1-0] 127.012932 s: CH | In Recv | In Drop | In User Drop | In Process
    [IPU1-0] 127.013023 s: | FPS | FPS | FPS | FPS
    [IPU1-0] 127.013084 s: --------------------------------------------------
    [IPU1-0] 127.013176 s: 0 | 83.33 0. 0 0. 0 83.33
    [IPU1-0] 127.013359 s:
    [IPU1-0] 127.013389 s: Output Statistics,
    [IPU1-0] 127.013450 s:
    [IPU1-0] 127.013481 s: CH | Out | Out | Out Drop | Out User Drop
    [IPU1-0] 127.013572 s: | ID | FPS | FPS | FPS
    [IPU1-0] 127.013633 s: ---------------------------------------------
    [IPU1-0] 127.013725 s: 0 | 0 83.33 0. 0 0. 0
    [IPU1-0] 127.013847 s:
    [IPU1-0] 127.013877 s: [ IPC_OUT_0 ] LATENCY,
    [IPU1-0] 127.013938 s: ********************
    [IPU1-0] 127.013999 s: Local Link Latency : Avg = 10 us, Min = 0 us, Max = 183 us,
    [IPU1-0] 127.014121 s: Source to Link Latency : Avg = 99 us, Min = 61 us, Max = 366 us,
    [IPU1-0] 127.014243 s:
    [IPU1-0] 127.514487 s:
    [IPU1-0] 127.514579 s: ### CPU [ DSP1], LinkID [ 10],
    [IPU1-0] 127.514701 s:
    [IPU1-0] 127.514762 s: [ IPC_IN_0 ] Link Statistics,
    [IPU1-0] 127.514853 s: ******************************
    [IPU1-0] 127.514945 s:
    [IPU1-0] 127.515006 s: Elapsed time = 83193 msec
    [IPU1-0] 127.515097 s:
    [IPU1-0] 127.515158 s: Get Full Buf Cb = 83.33 fps
    [IPU1-0] 127.515311 s: Put Empty Buf Cb = 83.33 fps
    [IPU1-0] 127.515433 s: Driver/Notify Cb = 83.32 fps
    [IPU1-0] 127.515524 s:
    [IPU1-0] 127.515555 s: Input Statistics,
    [IPU1-0] 127.515616 s:
    [IPU1-0] 127.515646 s: CH | In Recv | In Drop | In User Drop | In Process
    [IPU1-0] 127.515738 s: | FPS | FPS | FPS | FPS
    [IPU1-0] 127.515799 s: --------------------------------------------------
    [IPU1-0] 127.515890 s: 0 | 83.33 0. 0 0. 0 83.33
    [IPU1-0] 127.516012 s:
    [IPU1-0] 127.516073 s: Output Statistics,
    [IPU1-0] 127.516104 s:
    [IPU1-0] 127.516165 s: CH | Out | Out | Out Drop | Out User Drop
    [IPU1-0] 127.516409 s: | ID | FPS | FPS | FPS
    [IPU1-0] 127.516470 s: ---------------------------------------------
    [IPU1-0] 127.516561 s: 0 | 0 83.33 0. 0 0. 0
    [IPU1-0] 127.516683 s:
    [IPU1-0] 127.516714 s: [ IPC_IN_0 ] LATENCY,
    [IPU1-0] 127.516775 s: ********************
    [IPU1-0] 127.516836 s: Local Link Latency : Avg = 8 us, Min = 0 us, Max = 31 us,
    [IPU1-0] 127.516958 s: Source to Link Latency : Avg = 219 us, Min = 183 us, Max = 488 us,
    [IPU1-0] 127.517080 s:
    [IPU1-0] 127.517171 s:
    [IPU1-0] 127.517232 s: ### CPU [ DSP1], LinkID [ 49],
    [IPU1-0] 127.517324 s:
    [IPU1-0] 127.517385 s: [ ti.radar.fft ] Link Statistics,
    [IPU1-0] 127.517446 s: ******************************
    [IPU1-0] 127.517507 s:
    [IPU1-0] 127.517537 s: Elapsed time = 83196 msec
    [IPU1-0] 127.517629 s:
    [IPU1-0] 127.517659 s: New data Recv = 83.33 fps
    [IPU1-0] 127.517751 s:
    [IPU1-0] 127.517781 s: Input Statistics,
    [IPU1-0] 127.517842 s:
    [IPU1-0] 127.517873 s: CH | In Recv | In Drop | In User Drop | In Process
    [IPU1-0] 127.517964 s: | FPS | FPS | FPS | FPS
    [IPU1-0] 127.518025 s: --------------------------------------------------
    [IPU1-0] 127.518117 s: 0 | 83.33 0. 0 0. 0 83.33
    [IPU1-0] 127.518269 s:
    [IPU1-0] 127.518330 s: Output Statistics,
    [IPU1-0] 127.518361 s:
    [IPU1-0] 127.518422 s: CH | Out | Out | Out Drop | Out User Drop
    [IPU1-0] 127.518483 s: | ID | FPS | FPS | FPS
    [IPU1-0] 127.518575 s: ---------------------------------------------
    [IPU1-0] 127.518636 s: 0 | 0 83.33 0. 0 0. 0
    [IPU1-0] 127.518788 s:
    [IPU1-0] 127.518849 s: [ ti.radar.fft ] LATENCY,
    [IPU1-0] 127.518941 s: ********************
    [IPU1-0] 127.519002 s: Local Link Latency : Avg = 1413 us, Min = 1372 us, Max = 2226 us,
    [IPU1-0] 127.519185 s: Source to Link Latency : Avg = 1678 us, Min = 1616 us, Max = 2531 us,
    [IPU1-0] 127.519398 s:
    [IPU1-0] 127.519520 s: CPU [ DSP1], LinkID [ 25], Link Statistics not available !
    [IPU1-0] 127.519764 s:
    [IPU1-0] 127.519825 s: ### CPU [ DSP1], LinkID [ 51],
    [IPU1-0] 127.519917 s:
    [IPU1-0] 127.519978 s: [ ti.radar.drawfftheatmap ] Link Statistics,
    [IPU1-0] 127.520130 s: ******************************
    [IPU1-0] 127.520191 s:
    [IPU1-0] 127.520313 s: Elapsed time = 83195 msec
    [IPU1-0] 127.520405 s:
    [IPU1-0] 127.520435 s: New data Recv = 83.33 fps
    [IPU1-0] 127.520527 s:
    [IPU1-0] 127.520557 s: Input Statistics,
    [IPU1-0] 127.520618 s:
    [IPU1-0] 127.520649 s: CH | In Recv | In Drop | In User Drop | In Process
    [IPU1-0] 127.520740 s: | FPS | FPS | FPS | FPS
    [IPU1-0] 127.520801 s: --------------------------------------------------
    [IPU1-0] 127.520893 s: 0 | 83.33 23.33 0. 0 59.99
    [IPU1-0] 127.521015 s:
    [IPU1-0] 127.521045 s: Output Statistics,
    [IPU1-0] 127.521106 s:
    [IPU1-0] 127.521167 s: CH | Out | Out | Out Drop | Out User Drop
    [IPU1-0] 127.521381 s: | ID | FPS | FPS | FPS
    [IPU1-0] 127.521472 s: ---------------------------------------------
    [IPU1-0] 127.521564 s: 0 | 0 59.99 23.33 0. 0
    [IPU1-0] 127.521686 s:
    [IPU1-0] 127.521716 s: [ ti.radar.drawfftheatmap ] LATENCY,
    [IPU1-0] 127.521808 s: ********************
    [IPU1-0] 127.521869 s: Local Link Latency : Avg = 7867 us, Min = 7686 us, Max = 8052 us,
    [IPU1-0] 127.522784 s: Source to Link Latency : Avg = 10854 us, Min = 10614 us, Max = 11743 us,
    [IPU1-0] 127.522936 s:
    [IPU1-0] 127.523058 s:
    [IPU1-0] 127.523089 s: ### CPU [ DSP1], LinkID [ 1],
    [IPU1-0] 127.523180 s:
    [IPU1-0] 127.523302 s: [ IPC_OUT_1 ] Link Statistics,
    [IPU1-0] 127.523394 s: ******************************
    [IPU1-0] 127.523455 s:
    [IPU1-0] 127.523516 s: Elapsed time = 83179 msec
    [IPU1-0] 127.523577 s:
    [IPU1-0] 127.523607 s: New data Recv = 60.1 fps
    [IPU1-0] 127.523699 s: Release data Recv = 60.17 fps
    [IPU1-0] 127.523790 s: Driver/Notify Cb = 159.99 fps
    [IPU1-0] 127.523851 s:
    [IPU1-0] 127.523912 s: Input Statistics,
    [IPU1-0] 127.523973 s:
    [IPU1-0] 127.524034 s: CH | In Recv | In Drop | In User Drop | In Process
    [IPU1-0] 127.524126 s: | FPS | FPS | FPS | FPS
    [IPU1-0] 127.524217 s: --------------------------------------------------
    [IPU1-0] 127.524461 s: 0 | 60. 1 0. 0 0. 0 60. 1
    [IPU1-0] 127.524614 s:
    [IPU1-0] 127.524675 s: Output Statistics,
    [IPU1-0] 127.524736 s:
    [IPU1-0] 127.524766 s: CH | Out | Out | Out Drop | Out User Drop
    [IPU1-0] 127.524858 s: | ID | FPS | FPS | FPS
    [IPU1-0] 127.524919 s: ---------------------------------------------
    [IPU1-0] 127.525010 s: 0 | 0 60. 1 0. 0 0. 0
    [IPU1-0] 127.525132 s:
    [IPU1-0] 127.525163 s: [ IPC_OUT_1 ] LATENCY,
    [IPU1-0] 127.525285 s: ********************
    [IPU1-0] 127.525346 s: Local Link Latency : Avg = 4 us, Min = 0 us, Max = 31 us,
    [IPU1-0] 127.525468 s: Source to Link Latency : Avg = 11002 us, Min = 10737 us, Max = 11865 us,
    [IPU1-0] 127.525590 s:
    [IPU1-0] 128.025346 s:
    [IPU1-0] 128.025407 s: ### CPU [IPU1-0], LinkID [ 10],
    [IPU1-0] 128.025498 s:
    [IPU1-0] 128.025529 s: [ IPC_IN_0 ] Link Statistics,
    [IPU1-0] 128.025986 s: ******************************
    [IPU1-0] 128.026078 s:
    [IPU1-0] 128.026108 s: Elapsed time = 83189 msec
    [IPU1-0] 128.026200 s:
    [IPU1-0] 128.026230 s: Get Full Buf Cb = 59.99 fps
    [IPU1-0] 128.026993 s: Put Empty Buf Cb = 59.99 fps
    [IPU1-0] 128.027115 s: Driver/Notify Cb = 59.98 fps
    [IPU1-0] 128.027176 s:
    [IPU1-0] 128.027298 s: Input Statistics,
    [IPU1-0] 128.027694 s:
    [IPU1-0] 128.027755 s: CH | In Recv | In Drop | In User Drop | In Process
    [IPU1-0] 128.027847 s: | FPS | FPS | FPS | FPS
    [IPU1-0] 128.027908 s: --------------------------------------------------
    [IPU1-0] 128.028030 s: 0 | 59.99 0. 0 0. 0 59.99
    [IPU1-0] 128.028182 s:
    [IPU1-0] 128.028243 s: Output Statistics,
    [IPU1-0] 128.028335 s:
    [IPU1-0] 128.028365 s: CH | Out | Out | Out Drop | Out User Drop
    [IPU1-0] 128.028609 s: | ID | FPS | FPS | FPS
    [IPU1-0] 128.028701 s: ---------------------------------------------
    [IPU1-0] 128.028792 s: 0 | 0 59.99 0. 0 0. 0
    [IPU1-0] 128.028914 s:
    [IPU1-0] 128.028975 s: [ IPC_IN_0 ] LATENCY,
    [IPU1-0] 128.029036 s: ********************
    [IPU1-0] 128.029097 s: Local Link Latency : Avg = 21 us, Min = 0 us, Max = 244 us,
    [IPU1-0] 128.029219 s: Source to Link Latency : Avg = 11173 us, Min = 10889 us, Max = 12109 us,
    [IPU1-0] 128.029372 s:
    [IPU1-0] 128.029463 s:
    [IPU1-0] 128.029524 s: ### CPU [IPU1-0], LinkID [ 71],
    [IPU1-0] 128.029585 s:
    [IPU1-0] 128.029646 s: [ DISPLAY ] Link Statistics,
    [IPU1-0] 128.029707 s: ******************************
    [IPU1-0] 128.029799 s:
    [IPU1-0] 128.029829 s: Elapsed time = 83193 msec
    [IPU1-0] 128.029921 s:
    [IPU1-0] 128.029982 s: New data Recv = 60.0 fps
    [IPU1-0] 128.030073 s: Driver/Notify Cb = 60.0 fps
    [IPU1-0] 128.030165 s:
    [IPU1-0] 128.030226 s: Input Statistics,
    [IPU1-0] 128.030348 s:
    [IPU1-0] 128.030409 s: CH | In Recv | In Drop | In User Drop | In Process
    [IPU1-0] 128.030500 s: | FPS | FPS | FPS | FPS
    [IPU1-0] 128.030622 s: --------------------------------------------------
    [IPU1-0] 128.030744 s: 0 | 60. 0 0. 0 0. 0 60. 0
    [IPU1-0] 128.030897 s:
    [IPU1-0] 128.030958 s: Output Statistics,
    [IPU1-0] 128.031019 s:
    [IPU1-0] 128.031049 s: CH | Out | Out | Out Drop | Out User Drop
    [IPU1-0] 128.031171 s: | ID | FPS | FPS | FPS
    [IPU1-0] 128.031476 s: ---------------------------------------------
    [IPU1-0] 128.031568 s:
    [IPU1-0] 128.031690 s: [ DISPLAY ] LATENCY,
    [IPU1-0] 128.031781 s: ********************
    [IPU1-0] 128.031812 s: Local Link Latency : Avg = 52 us, Min = 30 us, Max = 244 us,
    [IPU1-0] 128.031934 s: Source to Link Latency : Avg = 11344 us, Min = 11072 us, Max = 12567 us,
    [IPU1-0] 128.032056 s:
    [IPU1-0] 128.032117 s: Display UnderFlow Count = 0
    [IPU1-0] 128.032178 s:
    [IPU1-0] 128.531598 s:
    [IPU1-0] 128.531690 s: ### CPU [ DSP1], LinkID [ 50],
    [IPU1-0] 128.531751 s:
    [IPU1-0] 128.531781 s: [ ti.radar.pkDetect ] Link Statistics,
    [IPU1-0] 128.531903 s: ******************************
    [IPU1-0] 128.531964 s:
    [IPU1-0] 128.532025 s: Elapsed time = 83188 msec
    [IPU1-0] 128.532086 s:
    [IPU1-0] 128.532147 s: New data Recv = 83.32 fps
    [IPU1-0] 128.532239 s:
    [IPU1-0] 128.532300 s: Input Statistics,
    [IPU1-0] 128.532513 s:
    [IPU1-0] 128.532574 s: CH | In Recv | In Drop | In User Drop | In Process
    [IPU1-0] 128.532666 s: | FPS | FPS | FPS | FPS
    [IPU1-0] 128.532727 s: --------------------------------------------------
    [IPU1-0] 128.532849 s: 0 | 83.32 0. 0 0. 0 83.32
    [IPU1-0] 128.532971 s:
    [IPU1-0] 128.533001 s: Output Statistics,
    [IPU1-0] 128.533062 s:
    [IPU1-0] 128.533093 s: CH | Out | Out | Out Drop | Out User Drop
    [IPU1-0] 128.533184 s: | ID | FPS | FPS | FPS
    [IPU1-0] 128.533276 s: ---------------------------------------------
    [IPU1-0] 128.533367 s: 0 | 0 83.32 0. 0 0. 0
    [IPU1-0] 128.533489 s:
    [IPU1-0] 128.533550 s: [ ti.radar.pkDetect ] LATENCY,
    [IPU1-0] 128.533611 s: ********************
    [IPU1-0] 128.533672 s: Local Link Latency : Avg = 1103 us, Min = 1037 us, Max = 1982 us,
    [IPU1-0] 128.533825 s: Source to Link Latency : Avg = 2923 us, Min = 2836 us, Max = 3782 us,
    [IPU1-0] 128.534008 s:
    [IPU1-0] 128.534069 s: CPU [ DSP1], LinkID [ 38], Link Statistics not available !
    [IPU1-0] 128.534374 s:
    [IPU1-0] 128.534435 s: ### CPU [ DSP1], LinkID [ 34],
    [IPU1-0] 128.534526 s:
    [IPU1-0] 128.534587 s: [ SYNC_0 ] Link Statistics,
    [IPU1-0] 128.534679 s: ******************************
    [IPU1-0] 128.534740 s:
    [IPU1-0] 128.534801 s: Elapsed time = 83194 msec
    [IPU1-0] 128.534892 s:
    [IPU1-0] 128.534953 s: New data Recv = 182.27 fps
    [IPU1-0] 128.535045 s: Get Full Buf Cb = 83.33 fps
    [IPU1-0] 128.535136 s: Put Empty Buf Cb = 83.32 fps
    [IPU1-0] 128.535258 s: Driver/Notify Cb = 30.30 fps
    [IPU1-0] 128.535380 s:
    [IPU1-0] 128.535411 s: Input Statistics,
    [IPU1-0] 128.535472 s:
    [IPU1-0] 128.535502 s: CH | In Recv | In Drop | In User Drop | In Process
    [IPU1-0] 128.535594 s: | FPS | FPS | FPS | FPS
    [IPU1-0] 128.535685 s: --------------------------------------------------
    [IPU1-0] 128.535746 s: 0 | 83.33 0. 0 0. 0 83.33
    [IPU1-0] 128.535899 s: 1 | 83.33 0. 0 0. 0 83.33
    [IPU1-0] 128.536021 s:
    [IPU1-0] 128.536051 s: Output Statistics,
    [IPU1-0] 128.536112 s:
    [IPU1-0] 128.536143 s: CH | Out | Out | Out Drop | Out User Drop
    [IPU1-0] 128.536234 s: | ID | FPS | FPS | FPS
    [IPU1-0] 128.536478 s: ---------------------------------------------
    [IPU1-0] 128.536570 s: 0 | 0 83.33 0. 0 0. 0
    [IPU1-0] 128.536692 s:
    [IPU1-0] 128.536722 s: [ SYNC_0 ] LATENCY,
    [IPU1-0] 128.536783 s: ********************
    [IPU1-0] 128.536844 s: Local Link Latency : Avg = 3509 us, Min = 0 us, Max = 10096 us,
    [IPU1-0] 128.536936 s: Source to Link Latency : Avg = 8800 us, Min = 2958 us, Max = 11926 us,
    [IPU1-0] 128.537058 s:
    [IPU1-0] 128.537180 s:
    [IPU1-0] 128.537211 s: ### CPU [ DSP1], LinkID [ 0],
    [IPU1-0] 128.537302 s:
    [IPU1-0] 128.537363 s: [ IPC_OUT_0 ] Link Statistics,
    [IPU1-0] 128.537424 s: ******************************
    [IPU1-0] 128.537485 s:
    [IPU1-0] 128.537546 s: Elapsed time = 83197 msec
    [IPU1-0] 128.537607 s:
    [IPU1-0] 128.537638 s: New data Recv = 83.33 fps
    [IPU1-0] 128.537729 s: Release data Recv = 83.33 fps
    [IPU1-0] 128.537790 s: Driver/Notify Cb = 183.31 fps
    [IPU1-0] 128.537882 s:
    [IPU1-0] 128.537912 s: Input Statistics,
    [IPU1-0] 128.537973 s:
    [IPU1-0] 128.538004 s: CH | In Recv | In Drop | In User Drop | In Process
    [IPU1-0] 128.538095 s: | FPS | FPS | FPS | FPS
    [IPU1-0] 128.538156 s: --------------------------------------------------
    [IPU1-0] 128.538248 s: 0 | 83.33 0. 0 0. 0 83.33
    [IPU1-0] 128.538400 s:
    [IPU1-0] 128.538461 s: Output Statistics,
    [IPU1-0] 128.538522 s:
    [IPU1-0] 128.538553 s: CH | Out | Out | Out Drop | Out User Drop
    [IPU1-0] 128.538644 s: | ID | FPS | FPS | FPS
    [IPU1-0] 128.538766 s: ---------------------------------------------
    [IPU1-0] 128.538888 s: 0 | 0 83.33 0. 0 0. 0
    [IPU1-0] 128.539041 s:
    [IPU1-0] 128.539071 s: [ IPC_OUT_0 ] LATENCY,
    [IPU1-0] 128.539163 s: ********************
    [IPU1-0] 128.539285 s: Local Link Latency : Avg = 3 us, Min = 0 us, Max = 31 us,
    [IPU1-0] 128.539468 s: Source to Link Latency : Avg = 8844 us, Min = 2989 us, Max = 11956 us,
    [IPU1-0] 128.539681 s:
    [IPU1-0] 129.039346 s:
    [IPU1-0] 129.039437 s: ### CPU [IPU1-1], LinkID [ 10],
    [IPU1-0] 129.039498 s:
    [IPU1-0] 129.039559 s: [ IPC_IN_0 ] Link Statistics,
    [IPU1-0] 129.039620 s: ******************************
    [IPU1-0] 129.039681 s:
    [IPU1-0] 129.039712 s: Elapsed time = 83195 msec
    [IPU1-0] 129.039803 s:
    [IPU1-0] 129.039834 s: Get Full Buf Cb = 83.33 fps
    [IPU1-0] 129.039925 s: Put Empty Buf Cb = 83.32 fps
    [IPU1-0] 129.039986 s: Driver/Notify Cb = 83.32 fps
    [IPU1-0] 129.040078 s:
    [IPU1-0] 129.040108 s: Input Statistics,
    [IPU1-0] 129.040169 s:
    [IPU1-0] 129.040200 s: CH | In Recv | In Drop | In User Drop | In Process
    [IPU1-0] 129.040291 s: | FPS | FPS | FPS | FPS
    [IPU1-0] 129.040383 s: --------------------------------------------------
    [IPU1-0] 129.040474 s: 0 | 83.33 0. 0 0. 0 83.33
    [IPU1-0] 129.040627 s:
    [IPU1-0] 129.040657 s: Output Statistics,
    [IPU1-0] 129.040718 s:
    [IPU1-0] 129.040749 s: CH | Out | Out | Out Drop | Out User Drop
    [IPU1-0] 129.040810 s: | ID | FPS | FPS | FPS
    [IPU1-0] 129.040901 s: ---------------------------------------------
    [IPU1-0] 129.040962 s: 0 | 0 83.33 0. 0 0. 0
    [IPU1-0] 129.041084 s:
    [IPU1-0] 129.041145 s: [ IPC_IN_0 ] LATENCY,
    [IPU1-0] 129.041206 s: ********************
    [IPU1-0] 129.041267 s: Local Link Latency : Avg = 34 us, Min = 30 us, Max = 92 us,
    [IPU1-0] 129.041542 s: Source to Link Latency : Avg = 9041 us, Min = 3202 us, Max = 12139 us,
    [IPU1-0] 129.041664 s:
    [IPU1-0] 129.041755 s:
    [IPU1-0] 129.041816 s: ### CPU [IPU1-1], LinkID [ 63],
    [IPU1-0] 129.041877 s:
    [IPU1-0] 129.041938 s: [ NETWORK TX ] Link Statistics,
    [IPU1-0] 129.041999 s: ******************************
    [IPU1-0] 129.042060 s:
    [IPU1-0] 129.042091 s: Elapsed time = 83197 msec
    [IPU1-0] 129.042182 s:
    [IPU1-0] 129.042213 s: New data Recv = 83.33 fps
    [IPU1-0] 129.042335 s:
    [IPU1-0] 129.042365 s: Input Statistics,
    [IPU1-0] 129.042426 s:
    [IPU1-0] 129.042487 s: CH | In Recv | In Drop | In User Drop | In Process
    [IPU1-0] 129.042609 s: | FPS | FPS | FPS | FPS
    [IPU1-0] 129.042731 s: --------------------------------------------------
    [IPU1-0] 129.042853 s: 0 | 83.33 0. 0 0. 0 83.33
    [IPU1-0] 129.043036 s:
    [IPU1-0] 129.043067 s: Output Statistics,
    [IPU1-0] 129.043158 s:
    [IPU1-0] 129.043219 s: CH | Out | Out | Out Drop | Out User Drop
    [IPU1-0] 129.043372 s: | ID | FPS | FPS | FPS
    [IPU1-0] 129.043494 s: ---------------------------------------------
    [IPU1-0] 129.043616 s:
    [IPU1-0] 129.043677 s: [ NETWORK TX ] LATENCY,
    [IPU1-0] 129.043768 s: ********************
    [IPU1-0] 129.043829 s: Local Link Latency : Avg = 1758 us, Min = 122 us, Max = 6679 us,
    [IPU1-0] 129.044378 s: Source to Link Latency : Avg = 10768 us, Min = 8480 us, Max = 12261 us,
    [IPU1-0] 129.044500 s:
    [IPU1-0] 129.544439 s: CPU [ IPU1-0], LinkID [ 23], Link Statistics not available !
    [IPU1-0] 129.544622 s:
    [IPU1-0] 129.544653 s: ### CPU [IPU1-0], LinkID [ 72],
    [IPU1-0] 129.544744 s:
    [IPU1-0] 129.544775 s: [ DISPLAY ] Link Statistics,
    [IPU1-0] 129.544836 s: ******************************
    [IPU1-0] 129.544897 s:
    [IPU1-0] 129.544927 s: Elapsed time = 115060 msec
    [IPU1-0] 129.545019 s:
    [IPU1-0] 129.545049 s: Driver/Notify Cb = 60.0 fps
    [IPU1-0] 129.545141 s:
    [IPU1-0] 129.545171 s: Input Statistics,
    [IPU1-0] 129.545232 s:
    [IPU1-0] 129.545263 s: CH | In Recv | In Drop | In User Drop | In Process
    [IPU1-0] 129.545385 s: | FPS | FPS | FPS | FPS
    [IPU1-0] 129.545476 s: --------------------------------------------------
    [IPU1-0] 129.545537 s: 0 | 0. 0 0. 0 0. 0 0. 0
    [IPU1-0] 129.545690 s:
    [IPU1-0] 129.545720 s: [ DISPLAY ] LATENCY,
    [IPU1-0] 129.545781 s: ********************
    [IPU1-0] 129.545842 s: Local Link Latency : Avg = 30 us, Min = 30 us, Max = 30 us,
    [IPU1-0] 129.545964 s: Source to Link Latency : Avg = 19734 us, Min = 19734 us, Max = 19734 us,
    [IPU1-0] 129.546086 s:
    [IPU1-0] 129.546117 s: Display UnderFlow Count = 0
    [IPU1-0] 129.546208 s:
    [IPU1-0] 130.045324 s:
    [IPU1-0]
    [IPU1-0] ====================
    [IPU1-0] Chains Run-time Menu
    [IPU1-0] ====================
    [IPU1-0]
    [IPU1-0] 0: Stop Chain
    [IPU1-0]
    [IPU1-0] c: Read-back and Check AR params
    [IPU1-0]
    [IPU1-0] d: Dynamically change params
    [IPU1-0]
    [IPU1-0] p: Print Performance Statistics
    [IPU1-0]
    [IPU1-0] Enter Choice:
    [IPU1-0]
  • Khai,

    In order to limit the drop only to the draw link and not propagate to the links before this due to the display running at 60 FPS, you would need to do a modification in the link as below:

    1. Add a field uint32_t dropFrameModulo; in AlgorithmLink_RadarProcessAlgCreateOpParams (vision_sdk\apps\src\rtos\radar\include\alglink_api\algorithmLink_radarProcess.h)
    2. Add a field uint32_t dropFrameModulo; in AlgorithmFxn_RadarDrawFFTHeatMapCreateParams
    (vision_sdk\apps\src\rtos\radar\include\alg_fxns\radarDrawFFTHeatMap_if.h)
    3. In the function AlgorithmFxn_RadarDrawFFTHeatMapCreate, add the following line at the end of the function:
    opParams->dropFrameModulo = pLinkCreateParams->dropFrameModulo;
    (vision_sdk\apps\src\rtos\radar\src\alg_plugins\alg_fxns\radardrawfftheatmap\radarDrawFFTHeatMap.c)
    4. In the function AlgorithmLink_radarProcessCreate, add the following line before calling alg_create as shown below:
    pAlgObj->createOpParams.dropFrameModulo = 0U; /* This is for initialization for other alg functions */
    pAlgObj->algHandle = pAlgObj->algFxnTbl->alg_create(pRadarProcessCreateParams,
    &pAlgObj->createOpParams);
    (vision_sdk\apps\src\rtos\radar\src\alg_plugins\radarprocess\radarProcessLink_algPlugin.c)
    5. In the function AlgorithmLink_radarProcessProcess, add the following logic;
    uint32_t processFrame = 0U;

    linkStatsInfo->linkStats.newDataCmdCount++;

    /*
    * Getting input buffers from previous link
    */
    System_getLinksFullBuffers(pAlgObj->algLinkCreateParams.inQueParams.prevLinkId,
    pAlgObj->algLinkCreateParams.inQueParams.prevLinkQueId,
    &inputBufList);

    if(inputBufList.numBuf)
    {
    for (bufId = 0; bufId < inputBufList.numBuf; bufId++)
    {
    pSysBufferInput = inputBufList.buffers[bufId];
    if(pSysBufferInput == NULL)
    {
    linkStatsInfo->linkStats.inBufErrorCount++;
    continue;
    }
    chNum = pSysBufferInput->chNum;
    linkStatsInfo->linkStats.chStats[chNum].inBufRecvCount++;
    if (pAlgObj->createOpParams.dropFrameModulo != 0)
    {
    if (linkStatsInfo->linkStats.chStats[chNum].inBufRecvCount % pAlgObj->createOpParams.dropFrameModulo == 0U)
    {
    /* Drop the frame Here */
    inputQId = 0;
    inputBufListReturn.numBuf = 1;
    inputBufListReturn.buffers[0] = pSysBufferInput;
    AlgorithmLink_releaseInputBuffer(
    pObj,
    inputQId,
    pAlgObj->algLinkCreateParams.inQueParams.prevLinkId,
    pAlgObj->algLinkCreateParams.inQueParams.prevLinkQueId,
    &inputBufListReturn,
    &bufDropFlag);
    processFrame = 0U;
    }
    else
    {
    processFrame = 1U;
    }
    }
    else
    {
    processFrame = 1U;
    }
    if (processFrame == 1U) /* Move on to process the frame */
    {
    /*
    * Getting free (empty) buffers from pool of output buffers
    */
    status = AlgorithmLink_getEmptyOutputBuffer(pObj,
    0,
    chNum,
    &pSysBufferOutput);
    ........
    /*
    * Releasing (Free'ing) input buffer, since algorithm does not need
    * it for any future usage.
    */
    inputQId = 0;
    inputBufListReturn.numBuf = 1;
    inputBufListReturn.buffers[0] = pSysBufferInput;
    AlgorithmLink_releaseInputBuffer(
    pObj,
    inputQId,
    pAlgObj->algLinkCreateParams.inQueParams.prevLinkId,
    pAlgObj->algLinkCreateParams.inQueParams.prevLinkQueId,
    &inputBufListReturn,
    &bufDropFlag);
    }
    }

    For example in the case where you are processing at 80 FPS and want to make sure the display running at 60 FPS does not affect the rest of the links. You would need to drop 20 frames (every 4 frames), Hence dropFrameModulo needs to be 4.

    Thanks and Regards,
    Piyali
  • Hi Piyali,

    I got the following statistics with your suggestion. Doesn't seem to work as you expected though.

    [IPU1-0] 21.644085 s:
    [IPU1-0] 21.644177 s: CPU [IPU1-0 ] Statistics,
    [IPU1-0] 21.644238 s: *************************
    [IPU1-0] 21.644299 s:
    [IPU1-0] 21.644329 s: LOAD: CPU: 17.9% HWI: 4.2%, SWI:0.7%, Low Power: 0.0%
    [IPU1-0] 21.644482 s:
    [IPU1-0] 21.644543 s: LOAD: TSK: IPC_IN_0 : 0.8%
    [IPU1-0] 21.644665 s: LOAD: TSK: IPC_OUT_0 : 2.0%
    [IPU1-0] 21.644787 s: LOAD: TSK: DISPLAY0 : 1.4%
    [IPU1-0] 21.644878 s: LOAD: TSK: ISSCAPTURE : 0.9%
    [IPU1-0] 21.645000 s: LOAD: TSK: GrpxSrc0 : 4.5%
    [IPU1-0] 21.645122 s: LOAD: TSK: STAT_COLL : 2.3%
    [IPU1-0] 21.645244 s: LOAD: TSK: MISC : 1.1%
    [IPU1-0] 21.645305 s:
    [IPU1-0] 21.645366 s: SYSTEM: SW Message Box Msg Pool, Free Msg Count = 1022
    [IPU1-0] 21.645458 s:
    [IPU1-0] 21.645488 s: SYSTEM: Sempahores Objects, 268 of 1050 free
    [IPU1-0] 21.645580 s: SYSTEM: Task Objects , 24 of 100 free
    [IPU1-0] 21.645671 s: SYSTEM: Clock Objects , 96 of 100 free
    [IPU1-0] 21.645763 s: SYSTEM: Hwi Objects , 84 of 100 free
    [IPU1-0] 21.645824 s:
    [IPU1-0] 21.645885 s: SYSTEM: Heap = LOCAL_DDR @ 0x00000000, Total size = 262144 B (256 KB), Free size = 258624 B (252 KB)
    [IPU1-0] 21.646037 s: SYSTEM: Heap = SR_OCMC @ 0x00000000, Total size = 0 B (0 KB), Free size = 0 B (0 KB)
    [IPU1-0] 21.646617 s: SYSTEM: Heap = SR_DDR_CACHED @ 0x85703000, Total size = 369086464 B (351 MB), Free size = 328916992 B (313 MB)
    [IPU1-0] 21.646800 s: SYSTEM: Heap = SR_DDR_NON_CACHED @ 0x00000000, Total size = 0 B (0 MB), Free size = 0 B (0 MB)
    [IPU1-0] 21.646952 s:
    [IPU1-0] 21.646983 s:
    [IPU1-0] 21.647044 s: CPU [IPU1-1 ] Statistics,
    [IPU1-0] 21.647166 s: *************************
    [IPU1-0] 21.647257 s:
    [IPU1-0] 21.647318 s: LOAD: CPU: 4.3% HWI: 1.1%, SWI:0.5%, Low Power: 0.0%
    [IPU1-0] 21.647471 s:
    [IPU1-0] 21.647532 s: LOAD: TSK: IPC_IN_0 : 0.8%
    [IPU1-0] 21.647684 s: LOAD: TSK: NETWORK TX0 : 1.0%
    [IPU1-0] 21.647806 s: LOAD: TSK: MISC : 0.9%
    [IPU1-0] 21.647898 s:
    [IPU1-0] 21.647928 s: SYSTEM: SW Message Box Msg Pool, Free Msg Count = 1022
    [IPU1-0] 21.648020 s:
    [IPU1-0] 21.648234 s: SYSTEM: Sempahores Objects, 428 of 1050 free
    [IPU1-0] 21.648356 s: SYSTEM: Task Objects , 36 of 100 free
    [IPU1-0] 21.648447 s: SYSTEM: Clock Objects , 99 of 100 free
    [IPU1-0] 21.648539 s: SYSTEM: Hwi Objects , 97 of 100 free
    [IPU1-0] 21.648630 s:
    [IPU1-0] 21.648691 s: SYSTEM: Heap = LOCAL_DDR @ 0x00000000, Total size = 262144 B (256 KB), Free size = 246224 B (240 KB)
    [IPU1-0] 21.648874 s:
    [IPU1-0] 21.648905 s:
    [IPU1-0] 21.648966 s: CPU [DSP1 ] Statistics,
    [IPU1-0] 21.649027 s: *************************
    [IPU1-0] 21.649271 s:
    [IPU1-0] 21.649332 s: LOAD: CPU: 48.1% HWI: 1.1%, SWI:0.3%, Low Power: 0.0%
    [IPU1-0] 21.649484 s:
    [IPU1-0] 21.649545 s: LOAD: TSK: MISC : 46.7%
    [IPU1-0] 21.649637 s:
    [IPU1-0] 21.649698 s: SYSTEM: SW Message Box Msg Pool, Free Msg Count = 1022
    [IPU1-0] 21.649789 s:
    [IPU1-0] 21.649820 s: SYSTEM: Sempahores Objects, 442 of 1050 free
    [IPU1-0] 21.649911 s: SYSTEM: Task Objects , 91 of 100 free
    [IPU1-0] 21.650003 s: SYSTEM: Clock Objects , 96 of 100 free
    [IPU1-0] 21.650125 s: SYSTEM: Hwi Objects , 98 of 100 free
    [IPU1-0] 21.650216 s:
    [IPU1-0] 21.650247 s: SYSTEM: Heap = LOCAL_L2 @ 0x00800000, Total size = 227264 B (221 KB), Free size = 227264 B (221 KB)
    [IPU1-0] 21.650491 s: SYSTEM: Heap = LOCAL_DDR @ 0x00000000, Total size = 524288 B (512 KB), Free size = 457128 B (446 KB)
    [IPU1-0] 21.651162 s:
    [IPU1-0] 21.651284 s:
    [IPU1-0] 21.651345 s: CPU [EVE1 ] Statistics,
    [IPU1-0] 21.651436 s: *************************
    [IPU1-0] 21.651497 s:
    [IPU1-0] 21.651589 s: LOAD: CPU: 19.4% HWI: 1.2%, SWI:0.2%, Low Power: 0.0%
    [IPU1-0] 21.651772 s:
    [IPU1-0] 21.651833 s: LOAD: TSK: MISC : 18.0%
    [IPU1-0] 21.651924 s:
    [IPU1-0] 21.651955 s: SYSTEM: SW Message Box Msg Pool, Free Msg Count = 1022
    [IPU1-0] 21.652046 s:
    [IPU1-0] 21.652138 s: SYSTEM: Sempahores Objects, 454 of 1050 free
    [IPU1-0] 21.652229 s: SYSTEM: Task Objects , 92 of 100 free
    [IPU1-0] 21.652321 s: SYSTEM: Clock Objects , 99 of 100 free
    [IPU1-0] 21.652382 s: SYSTEM: Hwi Objects , 97 of 100 free
    [IPU1-0] 21.652473 s:
    [IPU1-0] 21.652534 s: SYSTEM: Heap = LOCAL_L2 @ 0x40020000, Total size = 22528 B (22 KB), Free size = 8884 B (8 KB)
    [IPU1-0] 21.652687 s: SYSTEM: Heap = LOCAL_DDR @ 0x00000000, Total size = 262144 B (256 KB), Free size = 261008 B (254 KB)
    [IPU1-0] 21.652839 s:
    [IPU1-0] 21.653022 s:
    [IPU1-0] 21.653236 s: UTILS_PRCM_STATS: Current Temperature,
    [IPU1-0] 21.653327 s:
    [IPU1-0] 21.653358 s: Voltage Rail || Curr Temp Min - Max
    [IPU1-0] 21.653449 s: ---------------------------------------------------------
    [IPU1-0] 21.653541 s: PMHAL_PRCM_VD_CORE || [53.600 , 54. 0]
    [IPU1-0] 21.653632 s:
    [IPU1-0] 21.654120 s:
    [IPU1-0] 21.654212 s: Statistics Collector,
    [IPU1-0] 21.654242 s:
    [IPU1-0] 21.654303 s: STATISTIC Avg Data Peak Data
    [IPU1-0] 21.654364 s: COLLECTOR MB/s MB/s
    [IPU1-0] 21.654456 s: --------------------------------------------------
    [IPU1-0] 21.654547 s: SCI_EMIF_SYS | 39.663911 1105.225261
    [IPU1-0] 21.654639 s: SCI_IPU | 9.822526 175.385358
    [IPU1-0] 21.654761 s: SCI_DSP1_MDMA | 11.100707 1076.692679
    [IPU1-0] 21.654852 s: SCI_DSP2_MDMA | 0.000000 0.000000
    [IPU1-0] 21.654974 s: SCI_DSS | 0.000000 0.000000
    [IPU1-0] 21.655096 s: SCI_MMU | 0.000000 0.000000
    [IPU1-0] 21.655188 s: SCI_EDMA_TC0_RD | 0.000000 0.000000
    [IPU1-0] 21.655310 s: SCI_EDMA_TC0_WR | 0.000000 0.000000
    [IPU1-0] 21.655401 s: SCI_VIP_P1 | 0.000000 0.000000
    [IPU1-0] 21.655493 s: SCI_VIP_P2 | 0.000000 0.000000
    [IPU1-0] 21.655615 s: SCI_ISS_RT | 0.000000 0.000000
    [IPU1-0] 21.655798 s: SCI_ISS_NRT2 | 0.000000 0.000000
    [IPU1-0] 21.655920 s: SCI_EVE_P1 | 27.960641 399.534273
    [IPU1-0] 21.656011 s: SCI_EVE_P2 | 0.000000 0.000000
    [IPU1-0] 21.656164 s: SCI_GMAC_SW | 0.000000 0.000000
    [IPU1-0] 21.656255 s: SCI_ISS_NRT1 | 0.000000 0.000000
    [IPU1-0] 21.656347 s: SCI_DSP2_CFG | 0.000000 0.000000
    [IPU1-0] 21.656469 s: SCI_DSP2_EDMA | 0.000000 0.000000
    [IPU1-0] 21.656560 s: SCI_OCMC_RAM | 0.000000 0.000000
    [IPU1-0] 21.656652 s: SCI_DSP1_CFG | 0.000000 0.000000
    [IPU1-0] 21.656774 s: SCI_DSP1_EDMA | 0.000000 0.000000
    [IPU1-0] 21.656865 s: SCI_GPMC | 0.000000 0.000000
    [IPU1-0] 21.656957 s: SCI_MCASP | 0.000000 0.000000
    [IPU1-0] 21.657079 s: SCI_EDMA_TC1_RD | 0.000000 0.000000
    [IPU1-0] 21.657201 s: SCI_EDMA_TC1_WR | 0.000000 0.000000
    [IPU1-0] 21.757457 s:
    [IPU1-0] 21.757548 s:
    [IPU1-0] 21.757670 s:
    [IPU1-0] 21.757731 s: ### CPU [IPU1-0], LinkID [ 81],
    [IPU1-0] 21.757823 s:
    [IPU1-0] 21.757853 s: [ ISSCAPTURE ] Link Statistics,
    [IPU1-0] 21.757945 s: ******************************
    [IPU1-0] 21.758036 s:
    [IPU1-0] 21.758311 s: Elapsed time = 7120 msec
    [IPU1-0] 21.758402 s:
    [IPU1-0] 21.758433 s: Get Full Buf Cb = 82.86 fps
    [IPU1-0] 21.758524 s: Put Empty Buf Cb = 82.58 fps
    [IPU1-0] 21.758585 s: Driver/Notify Cb = 83.28 fps
    [IPU1-0] 21.758677 s:
    [IPU1-0] 21.758738 s: Input Statistics,
    [IPU1-0] 21.758768 s:
    [IPU1-0] 21.758829 s: CH | In Recv | In Drop | In User Drop | In Process
    [IPU1-0] 21.758921 s: | FPS | FPS | FPS | FPS
    [IPU1-0] 21.759012 s: --------------------------------------------------
    [IPU1-0] 21.759134 s: 0 | 82.72 0. 0 0. 0 82.72
    [IPU1-0] 21.759287 s:
    [IPU1-0] 21.759318 s: Output Statistics,
    [IPU1-0] 21.759379 s:
    [IPU1-0] 21.759409 s: CH | Out | Out | Out Drop | Out User Drop
    [IPU1-0] 21.759501 s: | ID | FPS | FPS | FPS
    [IPU1-0] 21.759745 s: ---------------------------------------------
    [IPU1-0] 21.759836 s: 0 | 0 82.86 0. 0 0. 0
    [IPU1-0] 21.759958 s:
    [IPU1-0] 21.759989 s: [ ISSCAPTURE ] LATENCY,
    [IPU1-0] 21.760111 s: ********************
    [IPU1-0] 21.760202 s:
    [IPU1-0] 21.760294 s:
    [IPU1-0] 21.760355 s: ### CPU [IPU1-0], LinkID [ 0],
    [IPU1-0] 21.760416 s:
    [IPU1-0] 21.760446 s: [ IPC_OUT_0 ] Link Statistics,
    [IPU1-0] 21.760538 s: ******************************
    [IPU1-0] 21.760599 s:
    [IPU1-0] 21.760629 s: Elapsed time = 7122 msec
    [IPU1-0] 21.760690 s:
    [IPU1-0] 21.760721 s: New data Recv = 82.84 fps
    [IPU1-0] 21.760843 s: Release data Recv = 82.84 fps
    [IPU1-0] 21.760934 s: Driver/Notify Cb = 182.81 fps
    [IPU1-0] 21.761056 s:
    [IPU1-0] 21.761148 s: Input Statistics,
    [IPU1-0] 21.761209 s:
    [IPU1-0] 21.761270 s: CH | In Recv | In Drop | In User Drop | In Process
    [IPU1-0] 21.761392 s: | FPS | FPS | FPS | FPS
    [IPU1-0] 21.761514 s: --------------------------------------------------
    [IPU1-0] 21.761636 s: 0 | 82.84 0. 0 0. 0 82.84
    [IPU1-0] 21.761788 s:
    [IPU1-0] 21.761849 s: Output Statistics,
    [IPU1-0] 21.761910 s:
    [IPU1-0] 21.761971 s: CH | Out | Out | Out Drop | Out User Drop
    [IPU1-0] 21.762093 s: | ID | FPS | FPS | FPS
    [IPU1-0] 21.762215 s: ---------------------------------------------
    [IPU1-0] 21.762337 s: 0 | 0 82.84 0. 0 0. 0
    [IPU1-0] 21.762490 s:
    [IPU1-0] 21.762520 s: [ IPC_OUT_0 ] LATENCY,
    [IPU1-0] 21.762581 s: ********************
    [IPU1-0] 21.762642 s: Local Link Latency : Avg = 10 us, Min = 0 us, Max = 31 us,
    [IPU1-0] 21.762734 s: Source to Link Latency : Avg = 105 us, Min = 61 us, Max = 213 us,
    [IPU1-0] 21.762856 s:
    [IPU1-0] 22.262215 s:
    [IPU1-0] 22.262337 s: ### CPU [ DSP1], LinkID [ 10],
    [IPU1-0] 22.262459 s:
    [IPU1-0] 22.262520 s: [ IPC_IN_0 ] Link Statistics,
    [IPU1-0] 22.262612 s: ******************************
    [IPU1-0] 22.262703 s:
    [IPU1-0] 22.262734 s: Elapsed time = 7624 msec
    [IPU1-0] 22.262825 s:
    [IPU1-0] 22.262886 s: Get Full Buf Cb = 82.63 fps
    [IPU1-0] 22.263008 s: Put Empty Buf Cb = 82.76 fps
    [IPU1-0] 22.263283 s: Driver/Notify Cb = 82.76 fps
    [IPU1-0] 22.263374 s:
    [IPU1-0] 22.263405 s: Input Statistics,
    [IPU1-0] 22.263466 s:
    [IPU1-0] 22.263496 s: CH | In Recv | In Drop | In User Drop | In Process
    [IPU1-0] 22.263588 s: | FPS | FPS | FPS | FPS
    [IPU1-0] 22.263649 s: --------------------------------------------------
    [IPU1-0] 22.263740 s: 0 | 82.76 0. 0 0. 0 82.76
    [IPU1-0] 22.263862 s:
    [IPU1-0] 22.263923 s: Output Statistics,
    [IPU1-0] 22.263954 s:
    [IPU1-0] 22.264015 s: CH | Out | Out | Out Drop | Out User Drop
    [IPU1-0] 22.264076 s: | ID | FPS | FPS | FPS
    [IPU1-0] 22.264167 s: ---------------------------------------------
    [IPU1-0] 22.264259 s: 0 | 0 82.76 0. 0 0. 0
    [IPU1-0] 22.264381 s:
    [IPU1-0] 22.264411 s: [ IPC_IN_0 ] LATENCY,
    [IPU1-0] 22.264472 s: ********************
    [IPU1-0] 22.264533 s: Local Link Latency : Avg = 9 us, Min = 0 us, Max = 31 us,
    [IPU1-0] 22.264655 s: Source to Link Latency : Avg = 3296 us, Min = 183 us, Max = 54413 us,
    [IPU1-0] 22.264777 s:
    [IPU1-0] 22.265509 s:
    [IPU1-0] 22.265601 s: ### CPU [ DSP1], LinkID [ 49],
    [IPU1-0] 22.265662 s:
    [IPU1-0] 22.265723 s: [ ti.radar.fft ] Link Statistics,
    [IPU1-0] 22.265784 s: ******************************
    [IPU1-0] 22.265845 s:
    [IPU1-0] 22.265875 s: Elapsed time = 7627 msec
    [IPU1-0] 22.265967 s:
    [IPU1-0] 22.265997 s: New data Recv = 82.73 fps
    [IPU1-0] 22.266058 s:
    [IPU1-0] 22.266150 s: Input Statistics,
    [IPU1-0] 22.266211 s:
    [IPU1-0] 22.266241 s: CH | In Recv | In Drop | In User Drop | In Process
    [IPU1-0] 22.266302 s: | FPS | FPS | FPS | FPS
    [IPU1-0] 22.266394 s: --------------------------------------------------
    [IPU1-0] 22.266485 s: 0 | 82.86 0.13 0. 0 62. 1
    [IPU1-0] 22.266607 s:
    [IPU1-0] 22.266638 s: Output Statistics,
    [IPU1-0] 22.266699 s:
    [IPU1-0] 22.266729 s: CH | Out | Out | Out Drop | Out User Drop
    [IPU1-0] 22.266821 s: | ID | FPS | FPS | FPS
    [IPU1-0] 22.266882 s: ---------------------------------------------
    [IPU1-0] 22.266973 s: 0 | 0 62. 1 0.13 0. 0
    [IPU1-0] 22.267095 s:
    [IPU1-0] 22.267126 s: [ ti.radar.fft ] LATENCY,
    [IPU1-0] 22.267187 s: ********************
    [IPU1-0] 22.267278 s: Local Link Latency : Avg = 2344 us, Min = 2287 us, Max = 2806 us,
    [IPU1-0] 22.267675 s: Source to Link Latency : Avg = 4822 us, Min = 2531 us, Max = 56945 us,
    [IPU1-0] 22.267797 s:
    [IPU1-0] 22.267858 s: CPU [ DSP1], LinkID [ 25], Link Statistics not available !
    [IPU1-0] 22.268010 s:
    [IPU1-0] 22.268041 s: ### CPU [ DSP1], LinkID [ 51],
    [IPU1-0] 22.268285 s:
    [IPU1-0] 22.268315 s: [ ti.radar.drawfftheatmap ] Link Statistics,
    [IPU1-0] 22.268407 s: ******************************
    [IPU1-0] 22.268468 s:
    [IPU1-0] 22.268498 s: Elapsed time = 7627 msec
    [IPU1-0] 22.268559 s:
    [IPU1-0] 22.268620 s: New data Recv = 62.1 fps
    [IPU1-0] 22.268681 s:
    [IPU1-0] 22.268742 s: Input Statistics,
    [IPU1-0] 22.268773 s:
    [IPU1-0] 22.268803 s: CH | In Recv | In Drop | In User Drop | In Process
    [IPU1-0] 22.268895 s: | FPS | FPS | FPS | FPS
    [IPU1-0] 22.268986 s: --------------------------------------------------
    [IPU1-0] 22.269047 s: 0 | 62. 1 2. 9 0. 0 59.91
    [IPU1-0] 22.269200 s:
    [IPU1-0] 22.269261 s: Output Statistics,
    [IPU1-0] 22.269291 s:
    [IPU1-0] 22.269352 s: CH | Out | Out | Out Drop | Out User Drop
    [IPU1-0] 22.269413 s: | ID | FPS | FPS | FPS
    [IPU1-0] 22.269474 s: ---------------------------------------------
    [IPU1-0] 22.269566 s: 0 | 0 59.91 2. 9 0. 0
    [IPU1-0] 22.269688 s:
    [IPU1-0] 22.269718 s: [ ti.radar.drawfftheatmap ] LATENCY,
    [IPU1-0] 22.269810 s: ********************
    [IPU1-0] 22.269840 s: Local Link Latency : Avg = 10739 us, Min = 10156 us, Max = 62466 us,
    [IPU1-0] 22.269962 s: Source to Link Latency : Avg = 16401 us, Min = 13207 us, Max = 68199 us,
    [IPU1-0] 22.270115 s:
    [IPU1-0] 22.270206 s:
    [IPU1-0] 22.270633 s: ### CPU [ DSP1], LinkID [ 1],
    [IPU1-0] 22.270755 s:
    [IPU1-0] 22.270786 s: [ IPC_OUT_1 ] Link Statistics,
    [IPU1-0] 22.270847 s: ******************************
    [IPU1-0] 22.270908 s:
    [IPU1-0] 22.270969 s: Elapsed time = 7566 msec
    [IPU1-0] 22.271030 s:
    [IPU1-0] 22.271060 s: New data Recv = 60.40 fps
    [IPU1-0] 22.271213 s: Release data Recv = 61.6 fps
    [IPU1-0] 22.271304 s: Driver/Notify Cb = 159.79 fps
    [IPU1-0] 22.271396 s:
    [IPU1-0] 22.271426 s: Input Statistics,
    [IPU1-0] 22.271487 s:
    [IPU1-0] 22.271548 s: CH | In Recv | In Drop | In User Drop | In Process
    [IPU1-0] 22.271609 s: | FPS | FPS | FPS | FPS
    [IPU1-0] 22.271731 s: --------------------------------------------------
    [IPU1-0] 22.271823 s: 0 | 60.40 0. 0 0. 0 60.40
    [IPU1-0] 22.271945 s:
    [IPU1-0] 22.272006 s: Output Statistics,
    [IPU1-0] 22.272036 s:
    [IPU1-0] 22.272097 s: CH | Out | Out | Out Drop | Out User Drop
    [IPU1-0] 22.272189 s: | ID | FPS | FPS | FPS
    [IPU1-0] 22.272280 s: ---------------------------------------------
    [IPU1-0] 22.272372 s: 0 | 0 60.40 0. 0 0. 0
    [IPU1-0] 22.272494 s:
    [IPU1-0] 22.272524 s: [ IPC_OUT_1 ] LATENCY,
    [IPU1-0] 22.272585 s: ********************
    [IPU1-0] 22.272677 s: Local Link Latency : Avg = 3 us, Min = 0 us, Max = 31 us,
    [IPU1-0] 22.272799 s: Source to Link Latency : Avg = 16569 us, Min = 13329 us, Max = 68321 us,
    [IPU1-0] 22.272921 s:
    [IPU1-0] 22.772189 s:
    [IPU1-0] 22.772250 s: ### CPU [IPU1-0], LinkID [ 10],
    [IPU1-0] 22.772341 s:
    [IPU1-0] 22.772372 s: [ IPC_IN_0 ] Link Statistics,
    [IPU1-0] 22.772433 s: ******************************
    [IPU1-0] 22.772494 s:
    [IPU1-0] 22.772524 s: Elapsed time = 8068 msec
    [IPU1-0] 22.772616 s:
    [IPU1-0] 22.772646 s: Get Full Buf Cb = 60.23 fps
    [IPU1-0] 22.772738 s: Put Empty Buf Cb = 59.86 fps
    [IPU1-0] 22.772890 s: Driver/Notify Cb = 60.11 fps
    [IPU1-0] 22.772982 s:
    [IPU1-0] 22.773012 s: Input Statistics,
    [IPU1-0] 22.773073 s:
    [IPU1-0] 22.773256 s: CH | In Recv | In Drop | In User Drop | In Process
    [IPU1-0] 22.773348 s: | FPS | FPS | FPS | FPS
    [IPU1-0] 22.773439 s: --------------------------------------------------
    [IPU1-0] 22.773500 s: 0 | 60.23 0. 0 0. 0 60.23
    [IPU1-0] 22.773653 s:
    [IPU1-0] 22.773683 s: Output Statistics,
    [IPU1-0] 22.773744 s:
    [IPU1-0] 22.773775 s: CH | Out | Out | Out Drop | Out User Drop
    [IPU1-0] 22.773836 s: | ID | FPS | FPS | FPS
    [IPU1-0] 22.773927 s: ---------------------------------------------
    [IPU1-0] 22.773988 s: 0 | 0 60.23 0. 0 0. 0
    [IPU1-0] 22.774141 s:
    [IPU1-0] 22.774171 s: [ IPC_IN_0 ] LATENCY,
    [IPU1-0] 22.774232 s: ********************
    [IPU1-0] 22.774690 s: Local Link Latency : Avg = 24 us, Min = 0 us, Max = 122 us,
    [IPU1-0] 22.774842 s: Source to Link Latency : Avg = 16737 us, Min = 13512 us, Max = 68474 us,
    [IPU1-0] 22.774964 s:
    [IPU1-0] 22.775056 s:
    [IPU1-0] 22.775147 s: ### CPU [IPU1-0], LinkID [ 71],
    [IPU1-0] 22.775269 s:
    [IPU1-0] 22.775300 s: [ DISPLAY ] Link Statistics,
    [IPU1-0] 22.775422 s: ******************************
    [IPU1-0] 22.775513 s:
    [IPU1-0] 22.775544 s: Elapsed time = 8071 msec
    [IPU1-0] 22.775635 s:
    [IPU1-0] 22.775696 s: New data Recv = 60.9 fps
    [IPU1-0] 22.775818 s: Driver/Notify Cb = 59.96 fps
    [IPU1-0] 22.775910 s:
    [IPU1-0] 22.775971 s: Input Statistics,
    [IPU1-0] 22.776032 s:
    [IPU1-0] 22.776093 s: CH | In Recv | In Drop | In User Drop | In Process
    [IPU1-0] 22.776245 s: | FPS | FPS | FPS | FPS
    [IPU1-0] 22.776367 s: --------------------------------------------------
    [IPU1-0] 22.776489 s: 0 | 60.21 0. 0 0. 0 60.21
    [IPU1-0] 22.776642 s:
    [IPU1-0] 22.776703 s: [ DISPLAY ] LATENCY,
    [IPU1-0] 22.776764 s: ********************
    [IPU1-0] 22.776855 s: Local Link Latency : Avg = 55 us, Min = 30 us, Max = 153 us,
    [IPU1-0] 22.777008 s: Source to Link Latency : Avg = 16943 us, Min = 13634 us, Max = 68687 us,
    [IPU1-0] 22.777130 s:
    [IPU1-0] 22.777160 s: Display UnderFlow Count = 0
    [IPU1-0] 22.777221 s:
    [IPU1-0] 23.277191 s:
    [IPU1-0] 23.277282 s: ### CPU [ DSP1], LinkID [ 50],
    [IPU1-0] 23.277343 s:
    [IPU1-0] 23.277404 s: [ ti.radar.pkDetect ] Link Statistics,
    [IPU1-0] 23.277465 s: ******************************
    [IPU1-0] 23.277526 s:
    [IPU1-0] 23.277557 s: Elapsed time = 8637 msec
    [IPU1-0] 23.277648 s:
    [IPU1-0] 23.277679 s: New data Recv = 62.5 fps
    [IPU1-0] 23.277740 s:
    [IPU1-0] 23.277801 s: Input Statistics,
    [IPU1-0] 23.277832 s:
    [IPU1-0] 23.277893 s: CH | In Recv | In Drop | In User Drop | In Process
    [IPU1-0] 23.277954 s: | FPS | FPS | FPS | FPS
    [IPU1-0] 23.278045 s: --------------------------------------------------
    [IPU1-0] 23.278289 s: 0 | 62. 5 0. 0 0. 0 46.54
    [IPU1-0] 23.278808 s:
    [IPU1-0] 23.278869 s: Output Statistics,
    [IPU1-0] 23.279021 s:
    [IPU1-0] 23.279052 s: CH | Out | Out | Out Drop | Out User Drop
    [IPU1-0] 23.279174 s: | ID | FPS | FPS | FPS
    [IPU1-0] 23.279265 s: ---------------------------------------------
    [IPU1-0] 23.279357 s: 0 | 0 46.54 0. 0 0. 0
    [IPU1-0] 23.279479 s:
    [IPU1-0] 23.279540 s: [ ti.radar.pkDetect ] LATENCY,
    [IPU1-0] 23.279631 s: ********************
    [IPU1-0] 23.279692 s: Local Link Latency : Avg = 954 us, Min = 915 us, Max = 1038 us,
    [IPU1-0] 23.279845 s: Source to Link Latency : Avg = 5826 us, Min = 3629 us, Max = 57982 us,
    [IPU1-0] 23.279967 s:
    [IPU1-0] 23.280028 s: CPU [ DSP1], LinkID [ 38], Link Statistics not available !
    [IPU1-0] 23.280211 s:
    [IPU1-0] 23.280241 s: ### CPU [ DSP1], LinkID [ 34],
    [IPU1-0] 23.280333 s:
    [IPU1-0] 23.280394 s: [ SYNC_0 ] Link Statistics,
    [IPU1-0] 23.280455 s: ******************************
    [IPU1-0] 23.280516 s:
    [IPU1-0] 23.280577 s: Elapsed time = 8805 msec
    [IPU1-0] 23.280638 s:
    [IPU1-0] 23.280699 s: New data Recv = 121.97 fps
    [IPU1-0] 23.280790 s: Get Full Buf Cb = 45.65 fps
    [IPU1-0] 23.280882 s: Put Empty Buf Cb = 45.65 fps
    [IPU1-0] 23.280943 s: Driver/Notify Cb = 30.21 fps
    [IPU1-0] 23.281034 s:
    [IPU1-0] 23.281065 s: Input Statistics,
    [IPU1-0] 23.281156 s:
    [IPU1-0] 23.281187 s: CH | In Recv | In Drop | In User Drop | In Process
    [IPU1-0] 23.281431 s: | FPS | FPS | FPS | FPS
    [IPU1-0] 23.281522 s: --------------------------------------------------
    [IPU1-0] 23.281614 s: 0 | 60.87 15.10 0. 0 45.65
    [IPU1-0] 23.281766 s: 1 | 45.65 0. 0 0. 0 45.65
    [IPU1-0] 23.281919 s:
    [IPU1-0] 23.281949 s: Output Statistics,
    [IPU1-0] 23.282010 s:
    [IPU1-0] 23.282041 s: CH | Out | Out | Out Drop | Out User Drop
    [IPU1-0] 23.282163 s: | ID | FPS | FPS | FPS
    [IPU1-0] 23.282224 s: ---------------------------------------------
    [IPU1-0] 23.282315 s: 0 | 0 45.65 0. 0 0. 0
    [IPU1-0] 23.282437 s:
    [IPU1-0] 23.282468 s: [ SYNC_0 ] LATENCY,
    [IPU1-0] 23.282529 s: ********************
    [IPU1-0] 23.282590 s: Local Link Latency : Avg = 5782 us, Min = 0 us, Max = 63747 us,
    [IPU1-0] 23.282773 s: Source to Link Latency : Avg = 16389 us, Min = 5032 us, Max = 68382 us,
    [IPU1-0] 23.282956 s:
    [IPU1-0] 23.283352 s:
    [IPU1-0] 23.283413 s: ### CPU [ DSP1], LinkID [ 0],
    [IPU1-0] 23.283535 s:
    [IPU1-0] 23.283566 s: [ IPC_OUT_0 ] Link Statistics,
    [IPU1-0] 23.283688 s: ******************************
    [IPU1-0] 23.283901 s:
    [IPU1-0] 23.283993 s: Elapsed time = 8579 msec
    [IPU1-0] 23.284420 s:
    [IPU1-0] 23.284481 s: New data Recv = 46.85 fps
    [IPU1-0] 23.284542 s: Release data Recv = 46.85 fps
    [IPU1-0] 23.284633 s: Driver/Notify Cb = 146.87 fps
    [IPU1-0] 23.284694 s:
    [IPU1-0] 23.284725 s: Input Statistics,
    [IPU1-0] 23.284786 s:
    [IPU1-0] 23.284816 s: CH | In Recv | In Drop | In User Drop | In Process
    [IPU1-0] 23.284908 s: | FPS | FPS | FPS | FPS
    [IPU1-0] 23.284969 s: --------------------------------------------------
    [IPU1-0] 23.285060 s: 0 | 46.85 0. 0 0. 0 46.85
    [IPU1-0] 23.285213 s:
    [IPU1-0] 23.285274 s: Output Statistics,
    [IPU1-0] 23.285335 s:
    [IPU1-0] 23.285365 s: CH | Out | Out | Out Drop | Out User Drop
    [IPU1-0] 23.285426 s: | ID | FPS | FPS | FPS
    [IPU1-0] 23.285518 s: ---------------------------------------------
    [IPU1-0] 23.285579 s: 0 | 0 46.85 0. 0 0. 0
    [IPU1-0] 23.285701 s:
    [IPU1-0] 23.285731 s: [ IPC_OUT_0 ] LATENCY,
    [IPU1-0] 23.285792 s: ********************
    [IPU1-0] 23.285853 s: Local Link Latency : Avg = 2 us, Min = 0 us, Max = 31 us,
    [IPU1-0] 23.285975 s: Source to Link Latency : Avg = 16447 us, Min = 5063 us, Max = 68413 us,
    [IPU1-0] 23.286097 s:
    [IPU1-0] 23.786219 s:
    [IPU1-0] 23.786280 s: ### CPU [IPU1-1], LinkID [ 10],
    [IPU1-0] 23.786372 s:
    [IPU1-0] 23.786402 s: [ IPC_IN_0 ] Link Statistics,
    [IPU1-0] 23.786463 s: ******************************
    [IPU1-0] 23.786524 s:
    [IPU1-0] 23.786585 s: Elapsed time = 9082 msec
    [IPU1-0] 23.786982 s:
    [IPU1-0] 23.787043 s: Get Full Buf Cb = 46.90 fps
    [IPU1-0] 23.787195 s: Put Empty Buf Cb = 46.90 fps
    [IPU1-0] 23.787287 s: Driver/Notify Cb = 46.79 fps
    [IPU1-0] 23.787378 s:
    [IPU1-0] 23.787409 s: Input Statistics,
    [IPU1-0] 23.787470 s:
    [IPU1-0] 23.787500 s: CH | In Recv | In Drop | In User Drop | In Process
    [IPU1-0] 23.787592 s: | FPS | FPS | FPS | FPS
    [IPU1-0] 23.787683 s: --------------------------------------------------
    [IPU1-0] 23.787897 s: 0 | 46.90 0. 0 0. 0 46.90
    [IPU1-0] 23.788019 s:
    [IPU1-0] 23.788049 s: Output Statistics,
    [IPU1-0] 23.788324 s:
    [IPU1-0] 23.788385 s: CH | Out | Out | Out Drop | Out User Drop
    [IPU1-0] 23.788476 s: | ID | FPS | FPS | FPS
    [IPU1-0] 23.788568 s: ---------------------------------------------
    [IPU1-0] 23.788659 s: 0 | 0 46.90 0. 0 0. 0
    [IPU1-0] 23.788781 s:
    [IPU1-0] 23.788812 s: [ IPC_IN_0 ] LATENCY,
    [IPU1-0] 23.788903 s: ********************
    [IPU1-0] 23.788934 s: Local Link Latency : Avg = 36 us, Min = 30 us, Max = 92 us,
    [IPU1-0] 23.789269 s: Source to Link Latency : Avg = 16646 us, Min = 5246 us, Max = 68596 us,
    [IPU1-0] 23.789391 s:
    [IPU1-0] 23.789574 s:
    [IPU1-0] 23.789605 s: ### CPU [IPU1-1], LinkID [ 63],
    [IPU1-0] 23.789696 s:
    [IPU1-0] 23.789727 s: [ NETWORK TX ] Link Statistics,
    [IPU1-0] 23.789788 s: ******************************
    [IPU1-0] 23.789849 s:
    [IPU1-0] 23.789910 s: Elapsed time = 9085 msec
    [IPU1-0] 23.789971 s:
    [IPU1-0] 23.790001 s: New data Recv = 46.78 fps
    [IPU1-0] 23.790093 s:
    [IPU1-0] 23.790154 s: Input Statistics,
    [IPU1-0] 23.790215 s:
    [IPU1-0] 23.790276 s: CH | In Recv | In Drop | In User Drop | In Process
    [IPU1-0] 23.790367 s: | FPS | FPS | FPS | FPS
    [IPU1-0] 23.790489 s: --------------------------------------------------
    [IPU1-0] 23.790611 s: 0 | 46.89 0. 0 0. 0 46.89
    [IPU1-0] 23.790794 s:
    [IPU1-0] 23.790855 s: [ NETWORK TX ] LATENCY,
    [IPU1-0] 23.790916 s: ********************
    [IPU1-0] 23.791008 s: Local Link Latency : Avg = 305 us, Min = 122 us, Max = 6771 us,
    [IPU1-0] 23.791191 s: Source to Link Latency : Avg = 16914 us, Min = 5368 us, Max = 68718 us,
    [IPU1-0] 23.791374 s:
    [IPU1-0] 24.291160 s: CPU [ IPU1-0], LinkID [ 23], Link Statistics not available !
    [IPU1-0] 24.291374 s:
    [IPU1-0] 24.291404 s: ### CPU [IPU1-0], LinkID [ 72],
    [IPU1-0] 24.291496 s:
    [IPU1-0] 24.291526 s: [ DISPLAY ] Link Statistics,
    [IPU1-0] 24.291587 s: ******************************
    [IPU1-0] 24.291648 s:
    [IPU1-0] 24.291679 s: Elapsed time = 9850 msec
    [IPU1-0] 24.291770 s:
    [IPU1-0] 24.291801 s: Driver/Notify Cb = 60.0 fps
    [IPU1-0] 24.291892 s:
    [IPU1-0] 24.291923 s: Input Statistics,
    [IPU1-0] 24.291953 s:
    [IPU1-0] 24.292014 s: CH | In Recv | In Drop | In User Drop | In Process
    [IPU1-0] 24.292075 s: | FPS | FPS | FPS | FPS
    [IPU1-0] 24.292197 s: --------------------------------------------------
    [IPU1-0] 24.292289 s: 0 | 0.10 0. 0 0. 0 0.10
    [IPU1-0] 24.292411 s:
    [IPU1-0] 24.292472 s: [ DISPLAY ] LATENCY,
    [IPU1-0] 24.292533 s: ********************
    [IPU1-0] 24.292563 s: Local Link Latency : Avg = 30 us, Min = 30 us, Max = 30 us,
    [IPU1-0] 24.292685 s: Source to Link Latency : Avg = 19765 us, Min = 19765 us, Max = 19765 us,
    [IPU1-0] 24.292807 s:
    [IPU1-0] 24.292838 s: Display UnderFlow Count = 0
    [IPU1-0] 24.292929 s:
    [IPU1-0] 24.792197 s:

  • Hi Piyali,

    Can you please address the issue? It didn't work per your suggestion to modify the code.Log sent above.

    Thanks,

    --Khai

  • Hi Khai,

    Can you please share the changes you have made? It would be good for us to review and ensure you have made the right changes.

    Thanks and Regards,

    Piyali

  • Code change zip file attachedsrc-change.zip

  • Thanks! Changes at a top level look okay. Can you please confirm if you are hitting the logic for the frame drop? You can place a break point in the following If condition to validate this.

    if (pAlgObj->createOpParams.dropFrameModulo != 0)
    {
    if (linkStatsInfo->linkStats.chStats[chNum].inBufRecvCount % pAlgObj->createOpParams.dropFrameModulo == 0U)
    {

    /* Break point here */

    /* Drop the frame Here */
    inputQId = 0;
    inputBufListReturn.numBuf = 1;
    inputBufListReturn.buffers[0] = pSysBufferInput;
    AlgorithmLink_releaseInputBuffer(
    pObj,
    inputQId,
    pAlgObj->algLinkCreateParams.inQueParams.prevLinkId,
    pAlgObj->algLinkCreateParams.inQueParams.prevLinkQueId,
    &inputBufListReturn,
    &bufDropFlag);
    processFrame = 0U;
    }
    else
    {
    processFrame = 1U;
    }
    }

    Regards,
    Piyali
  • Khai,

    I understand that you are not hitting the break point in this if condition, can you please read out the values of
    linkStatsInfo->linkStats.chStats[chNum].inBufRecvCount
    and pAlgObj->createOpParams.dropFrameModulo.

    You should see that linkStatsInfo->linkStats.chStats[chNum].inBufRecvCount should be incrementing every time you recieve a new frame.
    and pAlgObj->createOpParams.dropFrameModulo should be the value what you set for in the draw heat map alg function.

    Thanks and Regards,
    Piyali
  • Hi Piyali,

    If the break point doesn't get hit, how can i see they change. Can we look into this in tomorrow's call?

    Thanks,

    --Khai

  • Khai,

    As per the discussion, you were able to proceed by removing the display altogether. For the next issue you are facing you have openned a new thread. We will close this one.

    Thanks and Regards,
    Piyali
  • Hi Stanley/Piyali,

    I have  the latest dump of the stats below. Based on your analysis of this stats, can you confirm that the TDA3 is healthy and can keep up with the frame rate? I did a network monitor for throughput on the receiver PC. The reading dipped to 0 and recovered back to around 20MB/s at 35 seconds interval. 20MB/s (1/3 of the Gigie BW) which is not a lot to ask over a Gigie Ethernet. If the TDA3 can keep up, why is there still a dip?

    Thanks,

    --Khai

    [IPU1-0] 64.309064 s:
    [IPU1-0] 64.309156 s: CPU [IPU1-0 ] Statistics,
    [IPU1-0] 64.309217 s: *************************
    [IPU1-0] 64.309278 s:
    [IPU1-0] 64.309339 s: LOAD: CPU: 12.9% HWI: 3.9%, SWI:0.9%, Low Power: 0.0%
    [IPU1-0] 64.309491 s:
    [IPU1-0] 64.309583 s: LOAD: TSK: IPC_OUT_0 : 3.0%
    [IPU1-0] 64.309735 s: LOAD: TSK: ISSCAPTURE : 1.3%
    [IPU1-0] 64.309857 s: LOAD: TSK: STAT_COLL : 2.7%
    [IPU1-0] 64.310010 s: LOAD: TSK: MISC : 1.1%
    [IPU1-0] 64.310101 s:
    [IPU1-0] 64.310162 s: SYSTEM: SW Message Box Msg Pool, Free Msg Count = 1023
    [IPU1-0] 64.310254 s:
    [IPU1-0] 64.310284 s: SYSTEM: Sempahores Objects, 271 of 1050 free
    [IPU1-0] 64.310376 s: SYSTEM: Task Objects , 24 of 100 free
    [IPU1-0] 64.310467 s: SYSTEM: Clock Objects , 97 of 100 free
    [IPU1-0] 64.310559 s: SYSTEM: Hwi Objects , 84 of 100 free
    [IPU1-0] 64.310650 s:
    [IPU1-0] 64.310681 s: SYSTEM: Heap = LOCAL_DDR @ 0x00000000, Total size = 262144 B (256 KB), Free size = 258680 B (252 KB)
    [IPU1-0] 64.310833 s: SYSTEM: Heap = SR_OCMC @ 0x00000000, Total size = 0 B (0 KB), Free size = 0 B (0 KB)
    [IPU1-0] 64.311169 s: SYSTEM: Heap = SR_DDR_CACHED @ 0x85703000, Total size = 369086464 B (351 MB), Free size = 362176512 B (345 MB)
    [IPU1-0] 64.311352 s: SYSTEM: Heap = SR_DDR_NON_CACHED @ 0x00000000, Total size = 0 B (0 MB), Free size = 0 B (0 MB)
    [IPU1-0] 64.311504 s:
    [IPU1-0] 64.311565 s:
    [IPU1-0] 64.311596 s: CPU [IPU1-1 ] Statistics,
    [IPU1-0] 64.311657 s: *************************
    [IPU1-0] 64.311718 s:
    [IPU1-0] 64.311779 s: LOAD: CPU: 49.6% HWI: 5.7%, SWI:0.7%, Low Power: 0.0%
    [IPU1-0] 64.311901 s:
    [IPU1-0] 64.312023 s: LOAD: TSK: IPC_IN_0 : 1.8%
    [IPU1-0] 64.312145 s: LOAD: TSK: NETWORK TX0 : 8.2%
    [IPU1-0] 64.312267 s: LOAD: TSK: MISC : 33.2%
    [IPU1-0] 64.312724 s:
    [IPU1-0] 64.312785 s: SYSTEM: SW Message Box Msg Pool, Free Msg Count = 1023
    [IPU1-0] 64.312877 s:
    [IPU1-0] 64.312938 s: SYSTEM: Sempahores Objects, 426 of 1050 free
    [IPU1-0] 64.313060 s: SYSTEM: Task Objects , 36 of 100 free
    [IPU1-0] 64.313151 s: SYSTEM: Clock Objects , 99 of 100 free
    [IPU1-0] 64.313243 s: SYSTEM: Hwi Objects , 97 of 100 free
    [IPU1-0] 64.313365 s:
    [IPU1-0] 64.313426 s: SYSTEM: Heap = LOCAL_DDR @ 0x00000000, Total size = 262144 B (256 KB), Free size = 227552 B (222 KB)
    [IPU1-0] 64.313609 s:
    [IPU1-0] 64.313670 s:
    [IPU1-0] 64.313731 s: CPU [DSP1 ] Statistics,
    [IPU1-0] 64.313792 s: *************************
    [IPU1-0] 64.313883 s:
    [IPU1-0] 64.313914 s: LOAD: CPU: 7.2% HWI: 1.1%, SWI:0.2%, Low Power: 0.0%
    [IPU1-0] 64.314127 s:
    [IPU1-0] 64.314188 s: LOAD: TSK: MISC : 5.9%
    [IPU1-0] 64.314310 s:
    [IPU1-0] 64.314341 s: SYSTEM: SW Message Box Msg Pool, Free Msg Count = 1023
    [IPU1-0] 64.314463 s:
    [IPU1-0] 64.314524 s: SYSTEM: Sempahores Objects, 444 of 1050 free
    [IPU1-0] 64.314615 s: SYSTEM: Task Objects , 91 of 100 free
    [IPU1-0] 64.314737 s: SYSTEM: Clock Objects , 97 of 100 free
    [IPU1-0] 64.314860 s: SYSTEM: Hwi Objects , 98 of 100 free
    [IPU1-0] 64.314982 s:
    [IPU1-0] 64.315043 s: SYSTEM: Heap = LOCAL_L2 @ 0x00800000, Total size = 227264 B (221 KB), Free size = 227264 B (221 KB)
    [IPU1-0] 64.315409 s: SYSTEM: Heap = LOCAL_DDR @ 0x00000000, Total size = 524288 B (512 KB), Free size = 479136 B (467 KB)
    [IPU1-0] 64.315622 s:
    [IPU1-0] 64.315683 s:
    [IPU1-0] 64.315714 s: CPU [EVE1 ] Statistics,
    [IPU1-0] 64.315775 s: *************************
    [IPU1-0] 64.315836 s:
    [IPU1-0] 64.315927 s: LOAD: CPU: 37.5% HWI: 2.3%, SWI:0.1%, Low Power: 0.0%
    [IPU1-0] 64.316293 s:
    [IPU1-0] 64.316385 s: LOAD: TSK: MISC : 35.1%
    [IPU1-0] 64.316476 s:
    [IPU1-0] 64.316507 s: SYSTEM: SW Message Box Msg Pool, Free Msg Count = 1023
    [IPU1-0] 64.316598 s:
    [IPU1-0] 64.316629 s: SYSTEM: Sempahores Objects, 454 of 1050 free
    [IPU1-0] 64.316720 s: SYSTEM: Task Objects , 92 of 100 free
    [IPU1-0] 64.316812 s: SYSTEM: Clock Objects , 99 of 100 free
    [IPU1-0] 64.316903 s: SYSTEM: Hwi Objects , 97 of 100 free
    [IPU1-0] 64.317056 s:
    [IPU1-0] 64.317117 s: SYSTEM: Heap = LOCAL_L2 @ 0x40020000, Total size = 22528 B (22 KB), Free size = 8884 B (8 KB)
    [IPU1-0] 64.317300 s: SYSTEM: Heap = LOCAL_DDR @ 0x00000000, Total size = 262144 B (256 KB), Free size = 261008 B (254 KB)
    [IPU1-0] 64.317483 s:
    [IPU1-0] 64.317574 s:
    [IPU1-0] 64.317635 s: UTILS_PRCM_STATS: Current Temperature,
    [IPU1-0] 64.317727 s:
    [IPU1-0] 64.317757 s: Voltage Rail || Curr Temp Min - Max
    [IPU1-0] 64.317849 s: ---------------------------------------------------------
    [IPU1-0] 64.318001 s: PMHAL_PRCM_VD_CORE || [47.200 , 47.600]
    [IPU1-0] 64.318123 s:
    [IPU1-0] 64.318215 s:
    [IPU1-0] 64.318276 s: Statistics Collector,
    [IPU1-0] 64.318337 s:
    [IPU1-0] 64.318367 s: STATISTIC Avg Data Peak Data
    [IPU1-0] 64.318428 s: COLLECTOR MB/s MB/s
    [IPU1-0] 64.318520 s: --------------------------------------------------
    [IPU1-0] 64.318611 s: SCI_EMIF_SYS | 612.692995 892.897241
    [IPU1-0] 64.318733 s: SCI_IPU | 63.132543 83.374650
    [IPU1-0] 64.318825 s: SCI_DSP1_MDMA | 37.811760 56.655802
    [IPU1-0] 64.318977 s: SCI_DSP2_MDMA | 0.000000 0.000000
    [IPU1-0] 64.319099 s: SCI_DSS | 0.000000 0.000000
    [IPU1-0] 64.319191 s: SCI_MMU | 0.000000 0.000000
    [IPU1-0] 64.319282 s: SCI_EDMA_TC0_RD | 0.000000 0.000000
    [IPU1-0] 64.319404 s: SCI_EDMA_TC0_WR | 0.000000 0.000000
    [IPU1-0] 64.319496 s: SCI_VIP_P1 | 0.000000 0.000000
    [IPU1-0] 64.319618 s: SCI_VIP_P2 | 0.000000 0.000000
    [IPU1-0] 64.319709 s: SCI_ISS_RT | 70.110686 105.881311
    [IPU1-0] 64.320258 s: SCI_ISS_NRT2 | 0.000000 0.000000
    [IPU1-0] 64.320380 s: SCI_EVE_P1 | 282.905121 415.309734
    [IPU1-0] 64.320502 s: SCI_EVE_P2 | 148.370128 224.122309
    [IPU1-0] 64.320624 s: SCI_GMAC_SW | 20.107337 32.165456
    [IPU1-0] 64.320746 s: SCI_ISS_NRT1 | 0.000000 0.000000
    [IPU1-0] 64.320868 s: SCI_DSP2_CFG | 0.000000 0.000000
    [IPU1-0] 64.321265 s: SCI_DSP2_EDMA | 0.000000 0.000000
    [IPU1-0] 64.321417 s: SCI_OCMC_RAM | 0.000000 0.000000
    [IPU1-0] 64.321509 s: SCI_DSP1_CFG | 0.014922 0.022950
    [IPU1-0] 64.321600 s: SCI_DSP1_EDMA | 0.000000 0.000000
    [IPU1-0] 64.321722 s: SCI_GPMC | 0.000000 0.000000
    [IPU1-0] 64.321814 s: SCI_MCASP | 0.000000 0.000000
    [IPU1-0] 64.321997 s: SCI_EDMA_TC1_RD | 0.000000 0.000000
    [IPU1-0] 64.322119 s: SCI_EDMA_TC1_WR | 0.000000 0.000000
    [IPU1-0] 64.422009 s:
    [IPU1-0] 64.422070 s:
    [IPU1-0] 64.422161 s:
    [IPU1-0] 64.422222 s: ### CPU [IPU1-0], LinkID [ 81],
    [IPU1-0] 64.422314 s:
    [IPU1-0] 64.422344 s: [ ISSCAPTURE ] Link Statistics,
    [IPU1-0] 64.422405 s: ******************************
    [IPU1-0] 64.422466 s:
    [IPU1-0] 64.422527 s: Elapsed time = 8751 msec
    [IPU1-0] 64.422588 s:
    [IPU1-0] 64.422619 s: Get Full Buf Cb = 133.35 fps
    [IPU1-0] 64.422710 s: Put Empty Buf Cb = 133.35 fps
    [IPU1-0] 64.422893 s: Driver/Notify Cb = 133.24 fps
    [IPU1-0] 64.423015 s:
    [IPU1-0] 64.423076 s: Input Statistics,
    [IPU1-0] 64.423107 s:
    [IPU1-0] 64.423137 s: CH | In Recv | In Drop | In User Drop | In Process
    [IPU1-0] 64.423229 s: | FPS | FPS | FPS | FPS
    [IPU1-0] 64.423290 s: --------------------------------------------------
    [IPU1-0] 64.423381 s: 0 | 133.35 0. 0 0. 0 133.35
    [IPU1-0] 64.423534 s:
    [IPU1-0] 64.423564 s: Output Statistics,
    [IPU1-0] 64.423625 s:
    [IPU1-0] 64.423686 s: CH | Out | Out | Out Drop | Out User Drop
    [IPU1-0] 64.423747 s: | ID | FPS | FPS | FPS
    [IPU1-0] 64.423808 s: ---------------------------------------------
    [IPU1-0] 64.423900 s: 0 | 0 133.35 0. 0 0. 0
    [IPU1-0] 64.424052 s:
    [IPU1-0] 64.424113 s: [ ISSCAPTURE ] LATENCY,
    [IPU1-0] 64.424174 s: ********************
    [IPU1-0] 64.424235 s:
    [IPU1-0] 64.424327 s:
    [IPU1-0] 64.424388 s: ### CPU [IPU1-0], LinkID [ 0],
    [IPU1-0] 64.424449 s:
    [IPU1-0] 64.424479 s: [ IPC_OUT_0 ] Link Statistics,
    [IPU1-0] 64.424571 s: ******************************
    [IPU1-0] 64.424632 s:
    [IPU1-0] 64.424662 s: Elapsed time = 8752 msec
    [IPU1-0] 64.424723 s:
    [IPU1-0] 64.424784 s: New data Recv = 133.34 fps
    [IPU1-0] 64.425394 s: Release data Recv = 133.34 fps
    [IPU1-0] 64.425486 s: Driver/Notify Cb = 233.31 fps
    [IPU1-0] 64.425577 s:
    [IPU1-0] 64.425608 s: Input Statistics,
    [IPU1-0] 64.425669 s:
    [IPU1-0] 64.425699 s: CH | In Recv | In Drop | In User Drop | In Process
    [IPU1-0] 64.425760 s: | FPS | FPS | FPS | FPS
    [IPU1-0] 64.425852 s: --------------------------------------------------
    [IPU1-0] 64.426188 s: 0 | 133.34 0. 0 0. 0 133.34
    [IPU1-0] 64.426371 s:
    [IPU1-0] 64.426432 s: Output Statistics,
    [IPU1-0] 64.426493 s:
    [IPU1-0] 64.426554 s: CH | Out | Out | Out Drop | Out User Drop
    [IPU1-0] 64.426615 s: | ID | FPS | FPS | FPS
    [IPU1-0] 64.426706 s: ---------------------------------------------
    [IPU1-0] 64.426798 s: 0 | 0 133.34 0. 0 0. 0
    [IPU1-0] 64.427011 s:
    [IPU1-0] 64.427103 s: [ IPC_OUT_0 ] LATENCY,
    [IPU1-0] 64.427164 s: ********************
    [IPU1-0] 64.427225 s: Local Link Latency : Avg = 9 us, Min = 0 us, Max = 61 us,
    [IPU1-0] 64.427377 s: Source to Link Latency : Avg = 103 us, Min = 61 us, Max = 214 us,
    [IPU1-0] 64.427530 s:
    [IPU1-0] 64.927042 s:
    [IPU1-0] 64.927133 s: ### CPU [ DSP1], LinkID [ 10],
    [IPU1-0] 64.927286 s:
    [IPU1-0] 64.927774 s: [ IPC_IN_0 ] Link Statistics,
    [IPU1-0] 64.927865 s: ******************************
    [IPU1-0] 64.927926 s:
    [IPU1-0] 64.928018 s: Elapsed time = 8753 msec
    [IPU1-0] 64.928109 s:
    [IPU1-0] 64.928170 s: Get Full Buf Cb = 133.32 fps
    [IPU1-0] 64.928262 s: Put Empty Buf Cb = 133.32 fps
    [IPU1-0] 64.928353 s: Driver/Notify Cb = 133.21 fps
    [IPU1-0] 64.928445 s:
    [IPU1-0] 64.928506 s: Input Statistics,
    [IPU1-0] 64.928567 s:
    [IPU1-0] 64.928628 s: CH | In Recv | In Drop | In User Drop | In Process
    [IPU1-0] 64.928719 s: | FPS | FPS | FPS | FPS
    [IPU1-0] 64.928811 s: --------------------------------------------------
    [IPU1-0] 64.928902 s: 0 | 133.32 0. 0 0. 0 133.32
    [IPU1-0] 64.929146 s:
    [IPU1-0] 64.929207 s: Output Statistics,
    [IPU1-0] 64.929268 s:
    [IPU1-0] 64.929299 s: CH | Out | Out | Out Drop | Out User Drop
    [IPU1-0] 64.929390 s: | ID | FPS | FPS | FPS
    [IPU1-0] 64.929482 s: ---------------------------------------------
    [IPU1-0] 64.929604 s: 0 | 0 133.32 0. 0 0. 0
    [IPU1-0] 64.929756 s:
    [IPU1-0] 64.929817 s: [ IPC_IN_0 ] LATENCY,
    [IPU1-0] 64.929909 s: ********************
    [IPU1-0] 64.930000 s: Local Link Latency : Avg = 8 us, Min = 0 us, Max = 31 us,
    [IPU1-0] 64.930305 s: Source to Link Latency : Avg = 215 us, Min = 183 us, Max = 366 us,
    [IPU1-0] 64.930458 s:
    [IPU1-0] 64.930641 s:
    [IPU1-0] 64.930702 s: ### CPU [ DSP1], LinkID [ 49],
    [IPU1-0] 64.930793 s:
    [IPU1-0] 64.930824 s: [ ti.radar.fft ] Link Statistics,
    [IPU1-0] 64.930915 s: ******************************
    [IPU1-0] 64.931190 s:
    [IPU1-0] 64.931251 s: Elapsed time = 8756 msec
    [IPU1-0] 64.931312 s:
    [IPU1-0] 64.931373 s: New data Recv = 133.39 fps
    [IPU1-0] 64.931464 s:
    [IPU1-0] 64.931495 s: Input Statistics,
    [IPU1-0] 64.931556 s:
    [IPU1-0] 64.931617 s: CH | In Recv | In Drop | In User Drop | In Process
    [IPU1-0] 64.931678 s: | FPS | FPS | FPS | FPS
    [IPU1-0] 64.931769 s: --------------------------------------------------
    [IPU1-0] 64.931861 s: 0 | 133.39 0.22 0. 0 133.16
    [IPU1-0] 64.932074 s:
    [IPU1-0] 64.932135 s: Output Statistics,
    [IPU1-0] 64.932196 s:
    [IPU1-0] 64.932227 s: CH | Out | Out | Out Drop | Out User Drop
    [IPU1-0] 64.932318 s: | ID | FPS | FPS | FPS
    [IPU1-0] 64.932379 s: ---------------------------------------------
    [IPU1-0] 64.932471 s: 0 | 0 133.16 0.22 0. 0
    [IPU1-0] 64.932623 s:
    [IPU1-0] 64.932654 s: [ ti.radar.fft ] LATENCY,
    [IPU1-0] 64.932715 s: ********************
    [IPU1-0] 64.932776 s: Local Link Latency : Avg = 2253 us, Min = 2226 us, Max = 2349 us,
    [IPU1-0] 64.932898 s: Source to Link Latency : Avg = 2509 us, Min = 2440 us, Max = 2654 us,
    [IPU1-0] 64.933050 s:
    [IPU1-0] 64.933111 s: CPU [ DSP1], LinkID [ 25], Link Statistics not available !
    [IPU1-0] 64.933264 s:
    [IPU1-0] 64.933294 s: ### CPU [ DSP1], LinkID [ 50],
    [IPU1-0] 64.933386 s:
    [IPU1-0] 64.933416 s: [ ti.radar.pkDetect ] Link Statistics,
    [IPU1-0] 64.933508 s: ******************************
    [IPU1-0] 64.933569 s:
    [IPU1-0] 64.933599 s: Elapsed time = 8756 msec
    [IPU1-0] 64.933691 s:
    [IPU1-0] 64.933721 s: New data Recv = 133.16 fps
    [IPU1-0] 64.933813 s:
    [IPU1-0] 64.933843 s: Input Statistics,
    [IPU1-0] 64.933904 s:
    [IPU1-0] 64.933935 s: CH | In Recv | In Drop | In User Drop | In Process
    [IPU1-0] 64.934057 s: | FPS | FPS | FPS | FPS
    [IPU1-0] 64.934118 s: --------------------------------------------------
    [IPU1-0] 64.934209 s: 0 | 133.16 0. 0 0. 0 133.16
    [IPU1-0] 64.934331 s:
    [IPU1-0] 64.934392 s: Output Statistics,
    [IPU1-0] 64.934453 s:
    [IPU1-0] 64.934484 s: CH | Out | Out | Out Drop | Out User Drop
    [IPU1-0] 64.934545 s: | ID | FPS | FPS | FPS
    [IPU1-0] 64.934636 s: ---------------------------------------------
    [IPU1-0] 64.934697 s: 0 | 0 133.16 0. 0 0. 0
    [IPU1-0] 64.935246 s:
    [IPU1-0] 64.935307 s: [ ti.radar.pkDetect ] LATENCY,
    [IPU1-0] 64.935399 s: ********************
    [IPU1-0] 64.935460 s: Local Link Latency : Avg = 896 us, Min = 884 us, Max = 946 us,
    [IPU1-0] 64.935582 s: Source to Link Latency : Avg = 3526 us, Min = 3477 us, Max = 3691 us,
    [IPU1-0] 64.935704 s:
    [IPU1-0] 64.935765 s: CPU [ DSP1], LinkID [ 38], Link Statistics not available !
    [IPU1-0] 64.936253 s:
    [IPU1-0] 64.936314 s: ### CPU [ DSP1], LinkID [ 34],
    [IPU1-0] 64.936436 s:
    [IPU1-0] 64.936466 s: [ SYNC_0 ] Link Statistics,
    [IPU1-0] 64.936527 s: ******************************
    [IPU1-0] 64.936588 s:
    [IPU1-0] 64.936649 s: Elapsed time = 8752 msec
    [IPU1-0] 64.936741 s:
    [IPU1-0] 64.936802 s: New data Recv = 296.38 fps
    [IPU1-0] 64.936893 s: Get Full Buf Cb = 133.11 fps
    [IPU1-0] 64.937046 s: Put Empty Buf Cb = 133.11 fps
    [IPU1-0] 64.937137 s: Driver/Notify Cb = 30.39 fps
    [IPU1-0] 64.937229 s:
    [IPU1-0] 64.937259 s: Input Statistics,
    [IPU1-0] 64.937320 s:
    [IPU1-0] 64.937381 s: CH | In Recv | In Drop | In User Drop | In Process
    [IPU1-0] 64.937473 s: | FPS | FPS | FPS | FPS
    [IPU1-0] 64.937564 s: --------------------------------------------------
    [IPU1-0] 64.937656 s: 0 | 133.11 0. 0 0. 0 133.11
    [IPU1-0] 64.938022 s: 1 | 133.11 0. 0 0. 0 133.11
    [IPU1-0] 64.938235 s:
    [IPU1-0] 64.938266 s: Output Statistics,
    [IPU1-0] 64.938327 s:
    [IPU1-0] 64.938388 s: CH | Out | Out | Out Drop | Out User Drop
    [IPU1-0] 64.938479 s: | ID | FPS | FPS | FPS
    [IPU1-0] 64.938540 s: ---------------------------------------------
    [IPU1-0] 64.938632 s: 0 | 0 133.11 0. 0 0. 0
    [IPU1-0] 64.938784 s:
    [IPU1-0] 64.938815 s: [ SYNC_0 ] LATENCY,
    [IPU1-0] 64.938906 s: ********************
    [IPU1-0] 64.939028 s: Local Link Latency : Avg = 516 us, Min = 0 us, Max = 1098 us,
    [IPU1-0] 64.939150 s: Source to Link Latency : Avg = 3630 us, Min = 3568 us, Max = 3783 us,
    [IPU1-0] 64.939272 s:
    [IPU1-0] 64.939394 s:
    [IPU1-0] 64.939455 s: ### CPU [ DSP1], LinkID [ 0],
    [IPU1-0] 64.939547 s:
    [IPU1-0] 64.939608 s: [ IPC_OUT_0 ] Link Statistics,
    [IPU1-0] 64.939669 s: ******************************
    [IPU1-0] 64.939730 s:
    [IPU1-0] 64.939791 s: Elapsed time = 8754 msec
    [IPU1-0] 64.939852 s:
    [IPU1-0] 64.939882 s: New data Recv = 133.19 fps
    [IPU1-0] 64.940004 s: Release data Recv = 133.8 fps
    [IPU1-0] 64.940126 s: Driver/Notify Cb = 233.15 fps
    [IPU1-0] 64.940187 s:
    [IPU1-0] 64.940248 s: Input Statistics,
    [IPU1-0] 64.940309 s:
    [IPU1-0] 64.940340 s: CH | In Recv | In Drop | In User Drop | In Process
    [IPU1-0] 64.940431 s: | FPS | FPS | FPS | FPS
    [IPU1-0] 64.940523 s: --------------------------------------------------
    [IPU1-0] 64.940614 s: 0 | 133.19 0. 0 0. 0 133.19
    [IPU1-0] 64.940736 s:
    [IPU1-0] 64.940797 s: Output Statistics,
    [IPU1-0] 64.940828 s:
    [IPU1-0] 64.940889 s: CH | Out | Out | Out Drop | Out User Drop
    [IPU1-0] 64.941163 s: | ID | FPS | FPS | FPS
    [IPU1-0] 64.941255 s: ---------------------------------------------
    [IPU1-0] 64.941346 s: 0 | 0 133.19 0. 0 0. 0
    [IPU1-0] 64.941468 s:
    [IPU1-0] 64.941499 s: [ IPC_OUT_0 ] LATENCY,
    [IPU1-0] 64.941560 s: ********************
    [IPU1-0] 64.941621 s: Local Link Latency : Avg = 3 us, Min = 0 us, Max = 31 us,
    [IPU1-0] 64.941743 s: Source to Link Latency : Avg = 3663 us, Min = 3599 us, Max = 3843 us,
    [IPU1-0] 64.941865 s:
    [IPU1-0] 65.441224 s:
    [IPU1-0] 65.441316 s: ### CPU [IPU1-1], LinkID [ 10],
    [IPU1-0] 65.441407 s:
    [IPU1-0] 65.441438 s: [ IPC_IN_0 ] Link Statistics,
    [IPU1-0] 65.441499 s: ******************************
    [IPU1-0] 65.441590 s:
    [IPU1-0] 65.441621 s: Elapsed time = 8753 msec
    [IPU1-0] 65.441712 s:
    [IPU1-0] 65.441743 s: Get Full Buf Cb = 133.21 fps
    [IPU1-0] 65.441956 s: Put Empty Buf Cb = 133.21 fps
    [IPU1-0] 65.442109 s: Driver/Notify Cb = 133.9 fps
    [IPU1-0] 65.442200 s:
    [IPU1-0] 65.442231 s: Input Statistics,
    [IPU1-0] 65.442292 s:
    [IPU1-0] 65.442322 s: CH | In Recv | In Drop | In User Drop | In Process
    [IPU1-0] 65.442414 s: | FPS | FPS | FPS | FPS
    [IPU1-0] 65.442475 s: --------------------------------------------------
    [IPU1-0] 65.442566 s: 0 | 133.21 0. 0 0. 0 133.21
    [IPU1-0] 65.442719 s:
    [IPU1-0] 65.442749 s: Output Statistics,
    [IPU1-0] 65.442810 s:
    [IPU1-0] 65.442841 s: CH | Out | Out | Out Drop | Out User Drop
    [IPU1-0] 65.442902 s: | ID | FPS | FPS | FPS
    [IPU1-0] 65.443024 s: ---------------------------------------------
    [IPU1-0] 65.443115 s: 0 | 0 133.21 0. 0 0. 0
    [IPU1-0] 65.443237 s:
    [IPU1-0] 65.443268 s: [ IPC_IN_0 ] LATENCY,
    [IPU1-0] 65.443329 s: ********************
    [IPU1-0] 65.443390 s: Local Link Latency : Avg = 35 us, Min = 30 us, Max = 92 us,
    [IPU1-0] 65.443512 s: Source to Link Latency : Avg = 3860 us, Min = 3782 us, Max = 3996 us,
    [IPU1-0] 65.443634 s:
    [IPU1-0] 65.443756 s:
    [IPU1-0] 65.443786 s: ### CPU [IPU1-1], LinkID [ 63],
    [IPU1-0] 65.443878 s:
    [IPU1-0] 65.443908 s: [ NETWORK TX ] Link Statistics,
    [IPU1-0] 65.444000 s: ******************************
    [IPU1-0] 65.444061 s:
    [IPU1-0] 65.444122 s: Elapsed time = 8755 msec
    [IPU1-0] 65.444183 s:
    [IPU1-0] 65.444213 s: New data Recv = 133.29 fps
    [IPU1-0] 65.444305 s:
    [IPU1-0] 65.444335 s: Input Statistics,
    [IPU1-0] 65.444396 s:
    [IPU1-0] 65.444427 s: CH | In Recv | In Drop | In User Drop | In Process
    [IPU1-0] 65.444519 s: | FPS | FPS | FPS | FPS
    [IPU1-0] 65.444580 s: --------------------------------------------------
    [IPU1-0] 65.444671 s: 0 | 133.29 0. 0 0. 0 133.29
    [IPU1-0] 65.444824 s:
    [IPU1-0] 65.444854 s: Output Statistics,
    [IPU1-0] 65.445373 s:
    [IPU1-0] 65.445464 s: CH | Out | Out | Out Drop | Out User Drop
    [IPU1-0] 65.445556 s: | ID | FPS | FPS | FPS
    [IPU1-0] 65.445617 s: ---------------------------------------------
    [IPU1-0] 65.445739 s:
    [IPU1-0] 65.445769 s: [ NETWORK TX ] LATENCY,
    [IPU1-0] 65.445861 s: ********************
    [IPU1-0] 65.445922 s: Local Link Latency : Avg = 599 us, Min = 91 us, Max = 5002 us,
    [IPU1-0] 65.446349 s: Source to Link Latency : Avg = 4424 us, Min = 3873 us, Max = 8845 us,

  • Khai,

    The frame rates look fine throughout so from the logs TDA3x looks okay.

    Thanks and Regards,
    Piyali
  • Hi Piyali,

    Thanks for confirming the stats. Would you care to share your thought on why then there was a drop on the network throughput when I monitored it on the host PC?

    Thanks,

    --Khai

  • Hi Khai,

    Is this consistent and reproducible?

    Thanks and Regards,
    Piyali
  • Most definitely
  • Hi Khai,

    The dip is not expected...

    Since you are facing another issue and your original issue is resolved. Please open another thread with the details of the network dip. You can reference this thread in the new post.
    Please also share more information with respect to the periodicity of the issue and whether something specific needs to be done to reproduce this issue.

    Thanks and Regards,
    Piyali