This thread has been locked.

If you have a related question, please click the "Ask a related question" button in the top right corner. The newly created question will be automatically linked to this question.

TDA2HG: 【OpenGL】QT Weston Rendering bad performance

Part Number: TDA2HG

Hello:

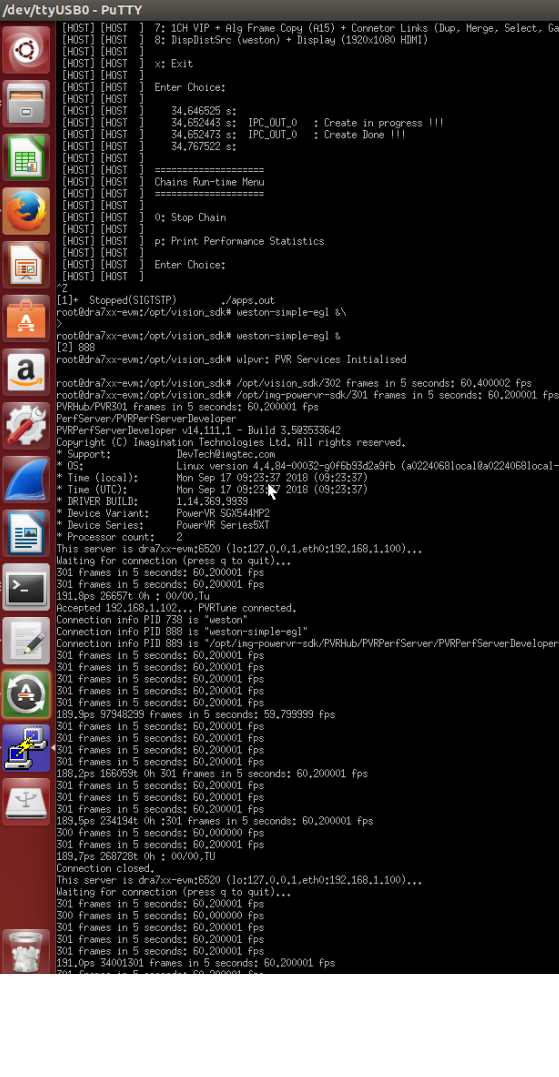
  we'are working on visionSDK 3.05 with QT 5.6, and we found the fps output of AVM only about 17 fps. see the diagram following:

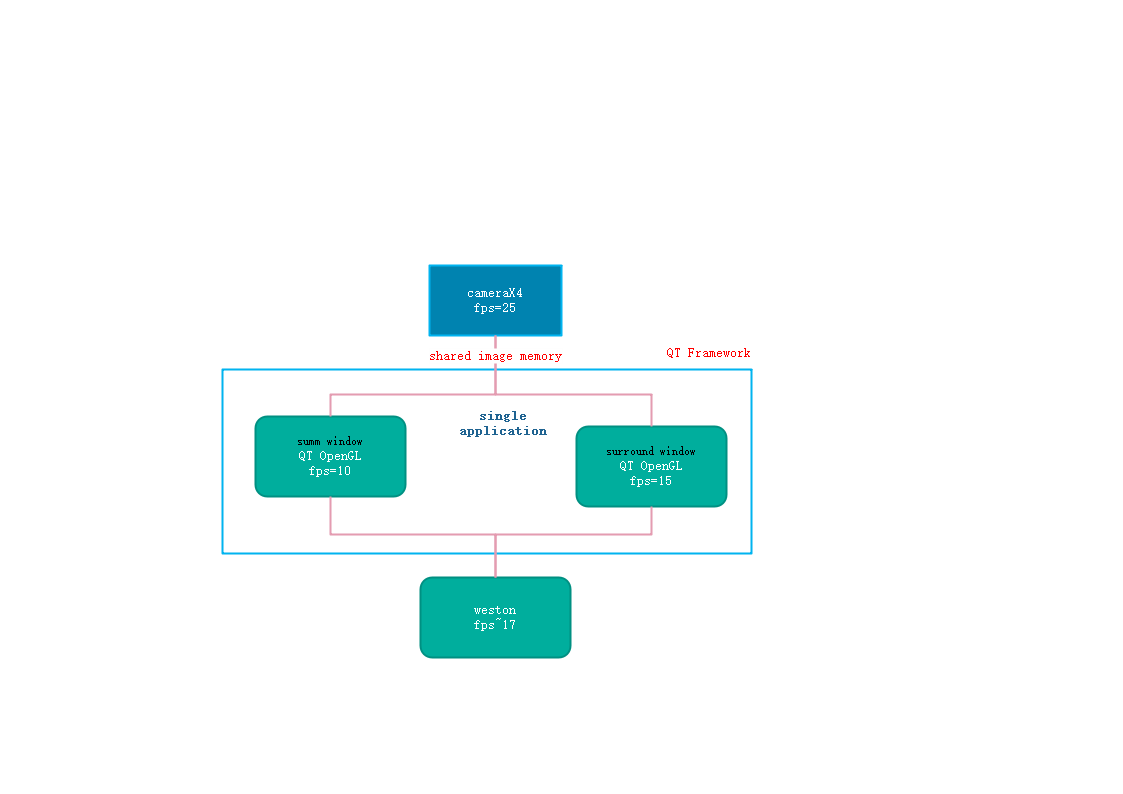
  1. one QT application has two windows(summ &surround)
  2. each window has individual OpenGl instance
  3. each OpenGl instance shared the camera image data(memory addr)

and from camera side, the fps is 25, each opengl instance have different fps, and final output to weston is only about 17 fps.

that mean, two opengl window is not rendering parallel, bu concurrency. am right?

and how we can let these two opengl window rendering quickly, for each, can reach 25 fps?

thanks

  • Hello,

    Can you please run PVRTune, save the pvrtune to a file and share it? More details here:

    https://www.imgtec.com/developers/powervr-sdk-tools/pvrtune/

  • Hi;

     please check  the attachment.

    thanks....

    gpu-perf.rar

  • Hello,

    Thanks a lot for PVRTune.

    Although it is not very clear from PVRTune but it seems like there are three renders from qt for 1 weston render. Render #1 and render #3 seem to be from the same qt application and render #2 seems different.

    I also see that Weston and qt app run in parallel. But qt app tasks do not run in parallel. While it is difficult to guess the exact reason for this, it could be how qt windows and tasks are interacting with each other. Do you have details on this? Might be worth checking on the qt side. Do you have more details?

    Regards

    Hemant

  • Hi Hemant:

     render #2 is the weston?

  • Hi Hemant:

    To make it simple, we disable one the QT OpenGL window, and found these paint code will consume about 60~80ms

    void SummWidget::paintGL()
    {
        // Clear color and depth buffers
        auto start = std::chrono::system_clock::now();
        printf("SummWidget::paintGL begin \n");
        ShowCurrentTime();
        glClear( GL_COLOR_BUFFER_BIT | GL_DEPTH_BUFFER_BIT);
    
        m_avmGpu->avm_gpu_process(1);
    
        m_overlay->overlay_render_start();
        m_overlay->bottom_render_process();
        m_overlay->assist_line_process(0);
        m_overlay->radar_render_process();
        m_overlay->overlay_render_end();
    
        m_carModel->render_process(1);
        
        GLenum gl_err = glGetError();
        if (gl_err != GL_NO_ERROR)
        {
            //SUMMWGT_LOG("SummWidget::paintGL. gl_error=%d\n", gl_err);
        }
        auto end = std::chrono::system_clock::now();
        PaintOneFrameTIme = std::chrono::duration_cast<std::chrono::microseconds>(end-start).count();
        std::chrono::duration<double> diff = end-start;
        std::cout<<"paint  time consume us"<<PaintOneFrameTIme<<std::endl;
        std::cout<<"paint diff time consume s"<<diff.count()<<std::endl;
        printf("SummWidget::paintGL end \n");
        ShowCurrentTime();
    }
    

    and check the pvrtune tool, it seems qt instance frame per second always12.5fps, it these any configuration to block QT openGL?

    and weston is also 12.5 fps

    please check the attachment.single qt window.rar

  • Hello,

    Thanks for the experiment and PVRTune. We see that when Weston render task is running, qt tiler task can run in parallel. But there is no parallel execution when qt tasks are running. Not sure if there is some serialization is happeing (e.g glFinish, glFlush or glReadPixels).

    Can we run some non qt tasks to check? May be something that runs slower than 60fps.

    Regards

    Hemant

  • Hi Hemant

     we run weston-simple-egl to check, pvrtune show about 60fps,but the log show about 40fps

    root@dra7xx-evm:~# weston-simple-egl 
    wlpvr: PVR Services Initialised
    179 frames in 5 seconds: 35.799999 fps
    156 frames in 5 seconds: 31.200001 fps
    171 frames in 5 seconds: 34.200001 fps
    159 frames in 5 seconds: 31.799999 fps
    179 frames in 5 seconds: 35.799999 fps
    172 frames in 5 seconds: 34.400002 fps
    163 frames in 5 seconds: 32.599998 fps
    172 frames in 5 seconds: 34.400002 fps
    163 frames in 5 seconds: 32.599998 fps
    ^Csimple-egl exiting
    wlpvr: PVR Services DeInitialised
    root@dra7xx-evm:~# 
    

    weston-simple-egl.rar

  • Hi Hemant:

      we force the QT to run single opengl instance with period 33ms.

    by the pvrtune, we see the total fps output is about 33fps and avm is about 15fps and weston fps is about 16 .

    if we kill avm, both fps is 0.so that mean the weston block the avm GPU?

    and correct my mistake that the painting of OpengGL is very fase, only need 1~2 ms.avm-weston.rar

  • Hi Hemant:

      Any update?

      Is it blocked by weston? can we remove weston and  use eglfs instead?

  • Dear Customer.

    we've tried run weston-simple-egl on VSDK03.05 + TI J6 EVM. the kernel log and PVR tune log all show that FPS reach to 60.

    thanks for your previous help. your log shows that FPS is only 35. This should be a difference.

    suggest to run below command to check GPU frequency firstly. and would you please check why there is such difference?

    "omapconf show opp"

    thanks a lot!

    yong

  • Dear Hemant.

    one question, we tested weston-simple-egl demo on TI J6 EVM. log shows 60 fps. would you please tell us how to calculate this fps?

    root@dra7xx-evm:/opt/vision_sdk# weston-simple-egl &\
    [2] 888

    301 frames in 5 seconds: 60.200001 fps
    301 frames in 5 seconds: 60.200001 fps

    301 frames in 5 seconds: 60.200001 fps
    301 frames in 5 seconds: 60.200001 fps
    301 frames in 5 seconds: 60.200001 fps
    301 frames in 5 seconds: 60.200001 fps
    301 frames in 5 seconds: 60.200001 fps

    Thanks a lot!

    yong

  • Hello All:

     we're migrate to visionsdk 3.08, here are the latest result

    root@dra7xx-evm:~# weston-simple-egl 
    wlpvr: PVR Services Initialised
    wlpvr: Creating Wayland Client surface 2 buffers for process pid=1216!
    293 frames in 5 seconds: 58.599998 fps
    283 frames in 5 seconds: 56.599998 fps
    190 frames in 5 seconds: 38.000000 fps
    254 frames in 5 seconds: 50.799999 fps
    292 frames in 5 seconds: 58.400002 fps
    296 frames in 5 seconds: 59.200001 fps
    282 frames in 5 seconds: 56.400002 fps
    211 frames in 5 seconds: 42.200001 fps
    215 frames in 5 seconds: 43.000000 fps
    286 frames in 5 seconds: 57.200001 fps
    294 frames in 5 seconds: 58.799999 fps
    286 frames in 5 seconds: 57.200001 fps
    193 frames in 5 seconds: 38.599998 fps
    222 frames in 5 seconds: 44.400002 fps
    291 frames in 5 seconds: 58.200001 fps
    292 frames in 5 seconds: 58.400002 fps
    283 frames in 5 seconds: 56.599998 fps
    218 frames in 5 seconds: 43.599998 fps
    234 frames in 5 seconds: 46.799999 fps
    288 frames in 5 seconds: 57.599998 fps
    294 frames in 5 seconds: 58.799999 fps
    285 frames in 5 seconds: 57.000000 fps
    210 frames in 5 seconds: 42.000000 fps
    219 frames in 5 seconds: 43.799999 fps

  • HI:

    see the pvrtrace in attachment.ecarx.log.rar

  • Dear Hemant. 

    Customer uploaded the PVRTrace log for their avm_qt_app application, use case like below that posted in the beginning of this ticket. 

    please help comment on it. 

    Thanks a lot!

    yong

    yong

  • Hello,

    Thank you for the trace. I can see the UI rendered along with some lines but no textures. Is it possible for you to provide a trace with TEXTURE_2D instead of TEXTURE_EXTERNAL_OES. This is only for debug.

    Can you also open this trace in PVRTrace GUI and confirm if the output looks okay?

    Regards

    Hemant

  • Hi hemant:

    Hemant Hariyani said:
    Can you also open this trace in PVRTrace GUI and confirm if the output looks okay?

     Yes, we open it in PVRTrace GUI, it can show parts of the log file, see the log

  • Hemant Hariyani said:
    I can see the UI rendered along with some lines but no textures.

    as the GUI only show the parts of the log, in that scene, the camera data is not load.

    Hemant Hariyani said:
    Is it possible for you to provide a trace with TEXTURE_2D instead of TEXTURE_EXTERNAL_OES. This is only for debug.

     will update later.

  • Hi Hemant :

      the attachment is the pvt trace that use GL_TEXTURE_2D instead of GL_TEXTURE_OES.

    for the unexpected EOF, we find it's the bug of PVRRecorder, we tried the latest version 2019R2, that not work. only the revision in PSDLA 6.03 works.

  • Hello,

    Seems like the attachment is missing. Can you please check and re-upload?

    Regards

    Hemant

  • Dear Hemant.

    Tried to use PVRTraceGUI 3.10 and PVRTraceGUI3.13 to open the PVRTrace log, ecarx.log-GL_TEXTURE_2D.rar. Still find the prompt dialog "unexpected end of file, topen partial trace?". So please check if the log is good for your check.

    and aligned with customer, they used the build-in img-powervr-sdk from PSDKLA 6_00_00_03 to capture that PVRTrace log.

    detail of the img-powervr-sdk folder like below. I only can print the version of PVRPerfServerDeveloper.

    if the log is not enough, please help guide us to capture good PVRTrace log. for example, which version of PVRTrace record tool can be used?

    Thanks a lot!

    yong

  • Hello,

    Thanks a lot for the trace. We are working with Imagination to analyze it and to see if unexpected end of file error is a problem.

    Can you please confirm the screen resolution? I believe we are targeting 1280x720.

    Can you also try running PVRTracePlayback on J6 to see that it looks okay visually and that we are not missing anything?

    Also, can you please capture PVRTune of this application running on J6 (not of the PVRTracePlayback, we need to run the application natively).

    Regards

    Hemant

  • Hello,

    Here is the feedback from Imagination:

    • There are two hard synchronisation points in each frame that causes a lack of task overlap. This is due to the two glFinish() calls in every frame. Without these the tasks would be packed much tighter, reducing frame times.
    • There is a glTexSubImage2D() call in most frames which creates a series of GPU transfer tasks and causes one CPU core to hit 100% usage. Could be an application side CPU bottleneck around this image upload.

    Can you please get rid of the two glFinish calls? Do we really need glTexSubImage2D calls every frame? It is best to avoid updating textures every frame. Is this really needed?

    Regards

    Hemant

  • Hi Hemant:

      Thanks very much, we'are checking now.

    our screen is 1920*720, has two render area

    1. summ:670x720
    2. surround:1280x720

  • Hi Hemant:

      As your known that AVM is based on QT framwork, just check that we have two QOpenGLWidget windows that each QOpenGLWidget will call the glFinish() .

    and glTexSubImage2D() also called in QT framework.

  • Hello,

    Understandable. Is it possible for you to check with qt for their recommendation? We will also look to see if we can find more.

    Regards

    Hemant

  • Hi Hemant:


    Hemant Hariyani said:
    Also, can you please capture PVRTune of this application running on J6 (not of the PVRTracePlayback, we need to run the application natively).

      how about, we share you with our AVM software, that you can debug on TI evm board?

  • Hi:

    please see the pvrtune in attachment.AVM-PVRTUNE-ECAR.rar

  • There are some inefficiencies that are leading to the performance drop. Some of these seem to be in QT framework:


    • The app is leaving around 12ms on the table due to the lack of task overlap resulting from the glFinish() calls. Without this it can reduce the average 44ms frame time to below 33ms, hitting the 30FPS target.
    • The tune indicates small clusters of frames separated by large 0.2 second gaps filled with 22 transfer kicks which is probably a result of the glTexSubImage() call every 2-3 frames. During this period a single CPU core always goes up to 100% usage which could be expected driver overhead since this tune recording is from a trace playback and so should not show any application CPU bottlenecks.
    • The shaders are mostly quite simple, but a few fragment shaders have branching on a varying input to select the appropriate texture to sample from, which could lead to dependent texture reads. It would be more ideal to instead split up the draws into multiple smaller draws for each material/texture instead of branching.
    • Blending is enabled for a majority of the frame, even for opaque draws which has an impact on performance.
    • Alpha blended draws with zero alpha are also submitted which have a significant Tiler workload. This can be minimised by culling any invisible draws. It may also be beneficial to draw opaque scene elements first, followed by alpha blended scene elements and finally alpha blended UI elements.

    • The application is generally renderer limited but we cannot pinpoint whether it is texture limited because of the lack of texturing related counters, but can assume it is looking at the shaders. There is one 1920x720 texture (attached below) that is drawn on a fullscreen quad at the end of the frame which is quite bandwidth heavy, so it might help to compress this and any other pre-authored textures with PVRTC. This is also the most expensive draw according to Trace, as the application is simply rendering a fullscreen quad and sampling a texture for each fragment and alpha blending it with the contents of the framebuffer. This is quite wasteful as you can see from the attached image, it is mostly transparent, but these texels are still sampled. A more optimal approach would be to split the image into smaller sub images and drawing them separately with alpha blending enabled only for the parts that make sense. This combined with texture compression would greatly reduce the overhead of the final draw.
    • This may be weston/qt and not in application control

      We need to work on getting eglfs working in this scenario and that should get us the performance boost. QT also seems to have bottlenecks that need to be addressed.

    Regards

    Hemant

  • Posted response from IMG in the previous post.

  • Hi:

     thanks for you update.

    Hemant Hariyani said:
    The tune indicates small clusters of frames separated by large 0.2 second gaps filled with 22 transfer kicks which is probably a result of the glTexSubImage() call every 2-3 frames. During this period a single CPU core always goes up to 100% usage which could be expected driver overhead since this tune recording is from a trace playback and so should not show any application CPU bottlenecks.

    we have fix it

  • Hi Hemant:

      we've optimise the glfinish() for two opengl widget and glTexSubImage2d(). but no performance improve.

    please help analyse the trace with IMG.(forward by local FAE)

    thanks very much!!

  • Dear Hemant.

    PVRTUNE log:

    1300.avm_qt_app-pvrtune.rar

    PVRtrace log, as log is large and exceed the E2E limitation of uploading file, I compress it again to four subdivisions. you can extract all 4 files together.

    avm_qt_app-pvr-1.zip.001

    avm_qt_app-pvr-1.zip.002

    avm_qt_app-pvr-1.zip.003

    avm_qt_app-pvr-1.zip.004

    And you can access TI driver to download them directly.

    https://tidrive.itg.ti.com/a/WCbtNPmm7TFKJu0_/698c24bc-bb2e-436e-9a57-446ee44ff6aa?l

    https://tidrive.itg.ti.com/a/NcwOvpRMDronzA61/8aef069b-7151-4e71-be97-458ceea242c5?l

    Thanks 

    yong

  • Hello,

    Some of those improvements can bee seen. But the app is still heavy on the render. Any updates on other suggestions that were made?

    Also, weston does cause additional overhead. Did EGLFS work?

    Regards

    Hemant

  • Hemant Hariyani said:
    Did EGLFS work

     not work,  as we have two app, and the avm_qt_app should run in background for fast reboot, and the eglfs can not support multiple instances, right?

  • Hello,

    As discussed earlier, the recommendation is to optimize the application rendering before the framework. We hope you were able to do that. If you face any more issues with the SDK, please let us know in a new thread.

    Regards

    Hemant