This thread has been locked.

If you have a related question, please click the "Ask a related question" button in the top right corner. The newly created question will be automatically linked to this question.

FDC1004: Effective resolution and frequency response

Part Number: FDC1004

Dear team, 

My customer are trying to design FDC1004 at Industrial proximity sensor application. so there are some questions. please review below question and let me know your opinion. 

1.  Effective resolution.

- In datasheet, Effective resolution is typ 16bit under sample rate 100S/s. Then what is effective resolution under 400S/s sample rate?

2. Frequency response

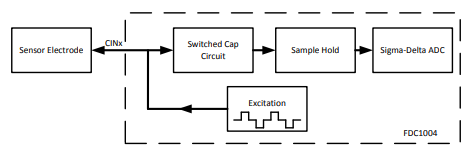
- I know the output of the FDC1004 is the measurement of the capacitance itself. it is a DC measurement . Is it right? 

  Please let me know the meaning of frequency response graph per sample rate (Figure7,8,9 in datasheet)?  

  Wat is meaning of frequency on FDC1004? Is it mean that how fast input capacitance changes? 

Please let me know your opinion. 

Thank you. 

  • Hello, 

    We do not have available data for the resolution at 400S/s but the effective resolution can be determined by taking a ratio of the full scale range to RMS measurement noise. This will vary per application but in general, faster sample rates will result in less resolution. 

    As for the frequency response questions, the FDC1004 does measure the actual capacitance using an excitation along with a sample and hold setup. See below: 

    You can find more information on this in the FDC1004: Basics of capacitive sensing and applications app note. 

    As for the frequency response graphs, I will need to check with a colleague on that once they are back next week and will give you an answer then. 

    Lastly, frequency has a couple different uses on the FDC1004: the clock frequency, the excitation frequency, and the sample rate which is sometimes referred to as a frequency. 

    Best Regards, 

  • Hello Justin, 

    Happy new year!!!

    Thank you for your comment. 

    Please let me know if you got a answer from your colleague regarding the frequency response graphs. 

    Thank you. 

  • Hello Dino, 

    Happy New Year to you as well. 

    I had a chance to discuss with my colleague about the graph. The frequency response graphs are the throughput bandwidth of the device at the different sample rates. As the sample rate increases, the bandwidth gets larger at the expense of resolution. 

    Best Regards, 

  • Hello Justin, 

    Thank you for your reply. 

    I don't understand regarding frequency response on FDC1004. 

    As you mentioned before, the FDC1004 does measure the actual capacitance using an excitation. Then, I think input data frequency is excitation frequency(25KHz). is it right?

    If input frequency is 25KHz, According to the frequency response graph on datasheet, data throughput is very poor at 25KHz frequency regardless of sample rate. 

    I think there is something I don't understand about frequency response on FDC1004. Please let me know your opinion. 

    Thank  you. 

  • Hello,

    The excitation is based on a 25 khz clock. The ADC does not measure the excitation frequency and measures the capacitance and hence called capacitance to digital converter. The excitation frequency is the frequency to the sensor and the ADC converts the measured capacitance to digital output. The frequency response graph indicates the throughput response of a capacitance measurement at different sample rates. So it should be viewed as how fast the capacitance changes with respect to change in capacitance measurement.