This thread has been locked.

If you have a related question, please click the "Ask a related question" button in the top right corner. The newly created question will be automatically linked to this question.

LDC1612: Inductive Sensing LDC1612

Part Number: LDC1612
Other Parts Discussed in Thread: LDC1101

Could I get some more information about Table 3 in Optimizing L Measurement Resolution for the LDC161x document?

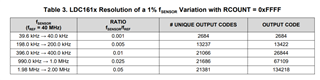
For example: The line 1.98MHz - 2.00MHz shows unique codes 21381 and output code 134218.

Using formula: Fsensor = Fref ( Datax / 2^28), the Datax = 13,421,772. That's exactly 100 time the output code. Are those values the changes that occur when the sense frequency changes 1% ?

If so, what actual value will be in the Datax register? Will the Datax register contain the 13,421,772? 

What does the 21381 represent. Does that mean that there will be a change of 21381 different values in the Datax register when the sense frequency changes 1% ?

I would like to understand what values are in the Datax register when the sense frequency is 2 MHz and how the Datax register changes for a 1% sense frequency change and what kind of resolution is possible.

Some actual number value examples would be very helpful showing the Datax register at 2 MHz and at 1.98 MHz and at least a few sequential values that would be in the Datax register while the frequency changes very slowly.

Sincerely,

Gary Tiani

  • Gary,

    Thank you for your inquiry and your interest in TI products.
    I will look into your questions and reply with some examples by Wednesday.

    Regards,
    John

  • Gary,

    The column OUTPUT CODE in Table 3 represents the number of codes you would get as the sensor changes from the lowest frequency to the highest frequency.
    You can see this by rewriting equation (4) in the data sheet to give the equivalent value of the output register:

    DATAx = f_sensor*(2^28)/f_ref   

    where DATAx would represent the output code value.

    If you substitute the min and max f_sensor values, and the reference frequency given in Table 3 of the app note , you will get the min and max ranges for the output codes (e.g.DATAx_MIN and DATAx_MAX).

    The code values in Table 3 column OUTPUT CODE are the difference between DATAx_max and Datax_min, representing all of the codes that lie between the min and max sensor frequencies.
    That column is mislabeled compared to the other columns. It should be named #OUTPUT CODES.

    The interaction of the sensor frequencies and the reference frequency can result in skipped DATAx codes as the sensor frequency sweeps from the min to the max frequency. This column #UNIQUE CODES captures this behavior by showing the number of codes that are not missed over the range.
    That column might be from measured data. 

    I hope this helps.
    Please let me know if you have any questions.

    Regards,
    John

  • Thank you for the information. I understand where most of the values come from. However, since our system uses different register settings than the example, I am trying to understand the "# Unique Codes" column. I'm trying to explain to our customer what the theoretical resolution is. You say "That column might be from measured data". Is there a way to calculate it? (since our settings are different, I'm assuming our #Unique Codes will also be different)

    Also, can you tell me the basic difference between the LDC1100 and LDC1612?

    The LDC1100 appears to adjust the oscillator current to maintain a constant resonant amplitude then measures the current.

    Does the LDC1612 keep a constant current and measure the amplitude of the resonant signal?

    I'm having a lot of trouble finding any information about the theory of operation. The resolution of the LDC1612 is phenomenally high. I realize that there are secrets that you can't reveal. However, can you say enough so that I can explain how such high resolution is possible?  

    I've read several methods for achieving such high resolution: 

    1. Using an ADC with filters to measure the resonant frequency amplitude.

    2. Using a PLL to generate a much higher frequency that is then used for counting.

    3. Looking for pulse coincidence between the sense_frequency and ref_frequency to eliminate phase shift errors.

    Without saying more than you should, can you just give me a very general description of the method used in the LDC1612? The manual for the LDC1100 goes into much more detail. But, the LDC1100 appears to use a fundamentally different method than the LDC1612.

    Without at least a fundamental theory of operation, it is hard to convince a customer that such incredible resolution is possible from such a tiny device.

    Sincerely,

    Gary Tiani

  • Gary,

    I don't have any calculations to offer that allow computing the column #Unique Codes.
    There are too many dependencies on the device settings and on the sensor parameters to be accurately captured in a simple model or calculator.
    This is an active area of work, but there are no results to share at this point.

    The LDC1101 does have an active amplitude control, and you are correct that it monitors current.
    The LDC1612 has a fixed current drive setting (IDRIVEx) and also supports an automated setting for IDRIVEx.
    For best performance, the manual IDRIVEx should be set to give a sensor Vp between 1.2V and 1.8V.
    Firmware may need to manage the IDRIVEx as the target moves thru its range.
    The LDC1612 also supports an automated IDRIVE setting if the sensor Rp is unknown. Section 8.1.5.2 of the data sheet gives the details.
    As the data sheet says, measurement repeatability and consistency is better with manually set IDRIVE.

    All of the LDC devices are doing conversions by basically counting sensor axis-crossings over a pre-defined number of reference oscillations (RCOUNT). 
    Unlike traditional A/D converters, the LDCs' results have dependencies on the sensor mechanical & electrical design, and the device settings. 
    As I said above, there are no practical way to work this into a set of workable calculations, but it an active area of work and I hope to share results in the near future. 

    You may have seen them already, but we have a number of on-line resources that might help with background information.
    The Inductive Sensing FAQ Page gives a list of resources and examples that might help.
    A number of related blog posts are available here.

    Regards,
    John

  • Hello John,

    Something is not right. With a clock of 40 MHz and RCOUNT of FFFF (65535), the sample time is 26 ms. 

    With a sense frequency of 2 MHz there are only 52428 zero crossings during the sample time.

    A sense frequency change of 1% gives only a data count change of 524 (unique values). The data sheet is showing 21381 unique values. That's a factor of 40 higher resolution.

    sensor frequency (Hz) clock frequency (Hz) Rcount sample time (sec) sense counts per sample time delta count data sheet factor 
    2000000 40000000 65535 0.026214 52428
    2020000 40000000 65535 0.026214 52952.28 524.28 21381 40.78164

    I pasted in my spread sheet above. I hope the formatting is readable. The data sheet is claiming 40 time higher resolution than is theoretically possible by simply counting zero crossings of the sense frequency. 

    Is there any more information that you can give me to justify a factor of 40 improvement in resolution?

    Can you please ask the chip designers if there is some other technique that is used. I'm not asking you to reveal any proprietary information. Just a high level description of some method that could account for a factor of 40 higher resolution would be very helpful.

    Sincerely,

    Gary 

  • Gary,

    One thing to consider is the inductive sensor acts as a bandpass filter on the input, and that the overall system is oversampled.

    The oversampling will increase in dynamic range (e.g. the effective resolution) because the input signal is being oversampled by a factor of (f_ref/f_sensor). 
    This could account for the factor of 40 that you see in your calculations.
    Another factor is the bandpass nature of the input sensor, which will bandlimit the input noise as a bandpass signal, as opposed to a low-pass signal. 
    This will tend to increase the dynamic range/effective resolution as well, but its not clear if its a big factor here.

    The total number of available codes (in Table 3 of the app note) can be calculated by the ratio of the sensor signal bandwidth to the reference frequency, and then multiplying by the number of available codes (= 2^28):

    #OUTPUT CODES = (2^28)*f_sensor/f_ref 

    This will reproduce the OUTPUT CODE column in Table 3.
    The #UNIQUE OUTPUT CODES is still a bit of a puzzle. I'm guessing the original author collaborated with the device designer to get that data via some device-level sims. That isn't an option at this moment.

    As I said earlier, more precise modeling and tools to help address these questions is an active area of work for me, but it will be a while before there are any useful results to report.

    Regards,
    John

  • I think I see what the LDC1612 is doing.

    The sample time is approximately RCOUNT*16/Ref_Freq = 26ms.

    However, the counting actually starts at the first low-to-high transition of the Sense signal and counts at the ref_freq rate.

    The counting stops after approximately 26 ms.

    However, the counting actually continues until the next low-to-high transition of the sense signal.

    That will allow the count resolution to be based on the higher frequency clock signal while still being somewhat synchronized to the sense signal.

    Using this method, the resolution and number of unique codes matches what is shown in the application document.

    The method is described in this website about a home-made frequency counter.

    https://www.instructables.com/High-Resolution-Frequency-Counter/

    Sincerely,

    Gary 


  • Thank you for the update Gary. Great information.
    I will definitely look at the page you referenced.

    Regards,
    John