


Hi Team,
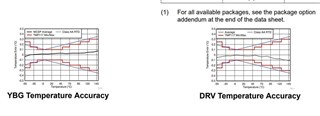
a customer is looking for a temperature sensor with guaranteed performance within 0.2°C @130-140°C.
Given the plot form the DS below, they are asking what makes the difference between the “average temp accuracy” and the min/max lines in red. Is it simply the variation between silicon, and does this mean that for a given sensor, the black curve is the same, but simply moved up or down?
Or to put it differently: if the linearity of the sensor is specified, they might be able to use that to compensate and still get within our required accuracy?
BR,
Stefan
