This thread has been locked.

If you have a related question, please click the "Ask a related question" button in the top right corner. The newly created question will be automatically linked to this question.

AWR6843ISK: AWR6843ISK

Part Number: AWR6843ISK

Tool/software:

Dear sir/madam,

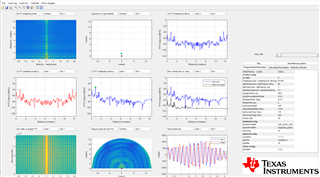
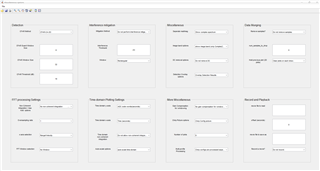
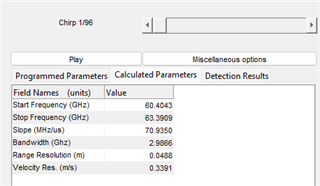
   I have captured the ADC level raw Data using AWR6843ISK +DCA 1000 card and  screen shots of  taken from mmwave studio  radar post processing tools are attached for your reference(which includes various plots,chirp parameter used for capturing, miscellaneous settings)

NOTE:we have captured scenario where person was sitting Infront of  AWR 6843ISK card with in 1 m distance.

I try to plot using our own signal processing module using captured data but results are not matching.

My questions:

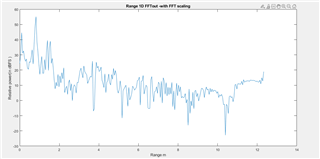
1.  as per "mmWave Studio GUI(pg no :62),plot :1D FFT amplitude profile is "‘non-coherent’ sum across chirps (per frame) and across antennas". can you confirm what kind of non coherent integration is used in Radar post processing tool?

2. as per "mmWave Studio GUI(pg no :60),plot :2D FFT profile is If the ‘common’ option is selected in the channel selector, then the non-coherent-sum of the 2D FFT output across channels is plotted.can you confirm what kind of non coherent integration is used in Radar post processing tool?

2. as per "mmWave Studio GUI(pg no :67),The detection algorithm is 2D-CFAR.can you confirm whether " direct 2D-CFAR algorithm is used or 1D_CFAR for range first then followed by 1D_CFAR for doppler to realize 2D-CFAR? 

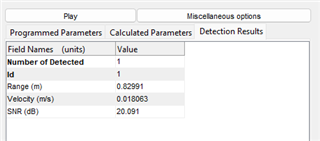
3  CFAR guard window size and  window sizes were used 8 and 32 ,which  correspond to first  CUT of  41(8+32 +1), and  which equals  range of  2.05 m( ie 41* 0.05(range res)).but in radar post processing tool able  to detect target placed at distance of 0.9 m,how does it work?

Regards,

Mani

  • Hi Mani,

    Thanks for posting your questions over E2E. Please allow us a day or so to respond.

    Regards,
    Deexith.

  • HI, Mani:

    You can find some help from the user guide at mmwave_studio_user_guide.pdf

    The non-coherent combination means sum in power cross different antennas in that chirp.  Which is the same to the 1D and 2D FFT. 

    I would not recommend to use the results after 2D FFT, the mmWave studio does not understand the antenna layout and was assuming all the RX antenna is in lamba/2 distance. And did not understand virtual antenna cross several TX chirps.    And we do not have any control over CFAR parameter setting and etc.  The source code for the post processing is not open to internal engineers.  

    Best,

    Zigang 

  • Hi zigzag,

    Thanks for your reply..

    The scenario captured using mmwave studio was for non-tdm mimo, captured data is  for 1 TX antenna + 4 Rx antenna case.so no virtual antenna won't come into picture..

    My question:

    1. You mentioned no control over CFAR parameters ,but in mmwave studio user guide mentioned ,Cfar parameters can be changed and postrocessing plot will  get update accordingly to changes on cfar parameters...please check and give your comments on it..

    2.as per "mmWave Studio GUI(pg no :67),The detection algorithm is 2D-CFAR.can you confirm whether " direct 2D-CFAR algorithm is used or 1D_CFAR for range first then followed by 1D_CFAR for doppler to realize 2D-CFAR? 

    3.the above postrocessing plots are captired with ,CFAR-CA-So type,CFAR threshold of 18 dB, CFAR guard window size and  window sizes were used 8 and 32 .The way Cfar algorithm works comparing CUT with average noise  around the CUT, so this case  considering CFAR parameters used,the first  CUT is 41(8+32 +1), and  which coreapomds in range is 2.05 m( ie 41* 0.05(range res)). So CFAR will process only target range above 2.05 m,but radar post processing tool is  able  to detect target placed at distance of 0.9 m,how does it work?can you confirm and share what Cfar parameters are used inside postrocessing, which will help to check with my own developed Cfar algorithm output with preprocessing tool.

    4. In the above postrocessing, 1D fft outputs are plotted on dbFs, can you explain, how to convert 1D FFT output to dbfs?

    5.do we need to any scaling function for 1d fft/range fft output ,since fft function is done on matlab?

    Regards,

    Mani

  • Hi, Mani:

    (1-3) I would suggest you to go to SDK Doxygen documentation for implementation details. 

    file:///C:/ti/mmwave_sdk_03_06_02_00-LTS/docs/mmwave_sdk_module_documentation.html

    You can find the implementation details for CFAR, and other modules, like AoA, Doppler, range FFT.   

    For 2D CFAR, there are two methods: 1) scan in each Doppler bin, find the peak group A that pass CFAR check in range direction, and then for each peak in A, find the peak that pass CFAR check in Doppler direction.   2) scan in Doppler bin, find the peak group A that pass CFAR check in range direction, and scan in Range bin, find the peak group B that pass CFAR check in Doppler direction, the peak will survive if it is in both A and B group.   Usually for CFAR implementation in HWA (hardware accelerator), we use method 2).  for CFAR implementation in process, we use method 1).   For the detection in edge bins, there will be some kinds of edge extension to help detect the bins that is in left edge (lower than winSize + guardSize) or right edge (larger than N - winSize - guardSize).   

    (4-5) You will need to plot the 1D FFT output in this way  20*log10(abs(fft(adcData/2^15)/fftSize))

    Best,

    Zigang

  • Dear zigang,

     thanks for your quick reply and recommendation.

    I tried to plot as you suggested" You will need to plot the 1D FFT output in this way  20*log10(abs(fft(adcData/2^15)/fftSize))".but results are not matching with post processing result snaphot attached earlier message( refer centre pic of 3X3 grid). i have attached plot result and code used for plotting for your reference.

    code used:


    Note: rangeFFTOut %%% this variable is range fft output with dimension of (256 x 96 x 4), where Range bin -256 ,no chirp-96,No channel -4

    %%%%%%%%%%% matlab code %%%%%%%%%%%%%%%%%%%%%%%%%%%%%%
    chirp_no_to_plot = 1;
    channel_no_to_plot = 1;
    %%selection_index = [chirp_no_to_plot channel_no_to_plot];
    Linear_scale =0 ;

    Range_1D_FFTout_value_1 = rangeFFTOut(:,chirp_no_to_plot,channel_no_to_plot);

    figure(96)
    if(Linear_scale == 1)
    plot(Rng_axis,abs(Range_1D_FFTout_value_1));
    ylabel('Relative power');
    else
    plot(Rng_axis,20*log10(abs(Range_1D_FFTout_value_1/Range_FFT_size)) );
    ylabel('Relative power(in dBFS ) ');

    end
    title('Range 1D FFTout -with FFT scaling');
    xlabel('Range m');
    %%%%

    My question:

    1. please check and give your comments ,let me know,if i made any mistake in the plotting?

    2.i have seen some scaling document shared in other thread related to mmwave studio related and i m attaching snapshot of it for your reference,please check and give your comments.

  • Hi, there:

    I could be wrong.   Agree with your plot below. 

    I would suggest you to generate a sin wave with full swing and plot the FFT output to figure out the scale.

    Best,

    Zigang