This thread has been locked.

If you have a related question, please click the "Ask a related question" button in the top right corner. The newly created question will be automatically linked to this question.

DCA1000EVM: Making sense of raw adc data

Part Number: DCA1000EVM
Other Parts Discussed in Thread: IWR1642BOOST

Hello,

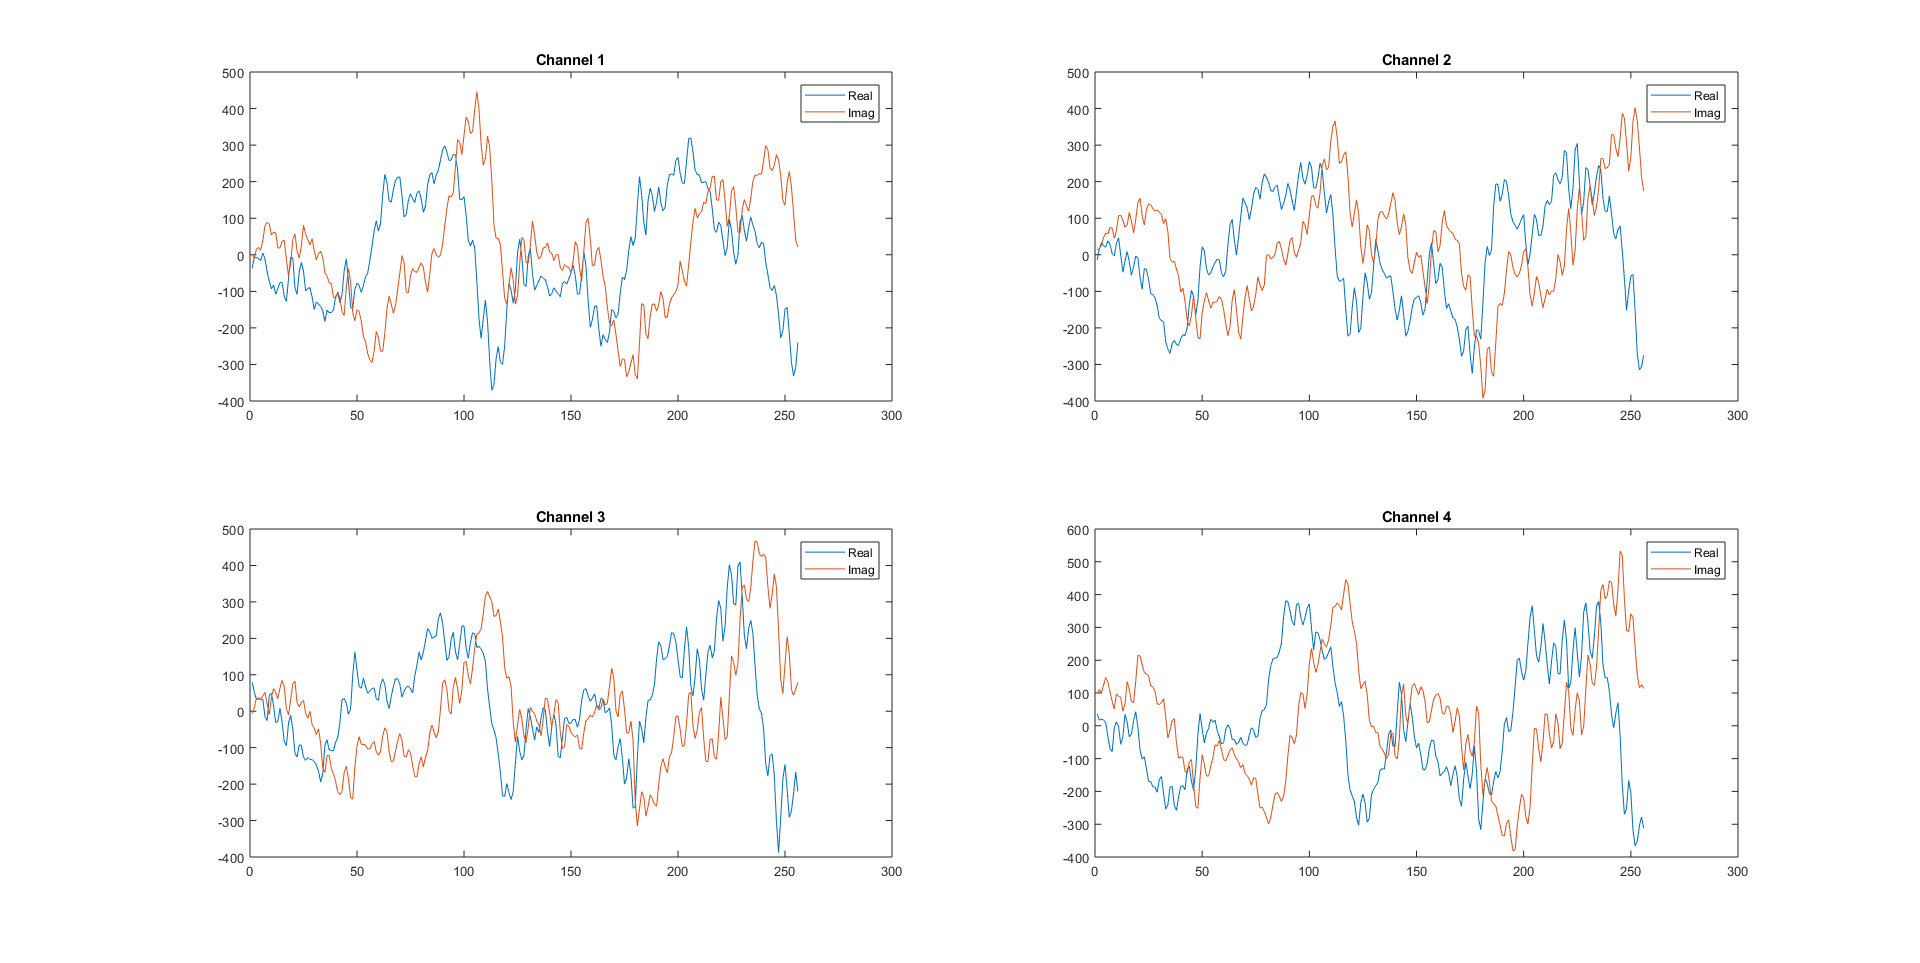
I am trying to view raw adc data that is captured from an IWR1642BOOST and streamed through an ethernet cable to my PC. I was able to capture several seconds of data using mmwave studio. Currently, I'm opening the adc_data.bin file in MATLAB using the following code:

dir_name = 'C:\ti\mmwave_studio_02_00_00_02\mmWaveStudio\PostProc\';
file_name_bin = 'adc_data.bin';
file_path_bin = strcat(dir_name, file_name_bin);
fid_bin = fopen(file_path_bin);
dataBin = fread(fid_bin, 'uint8');
fclose(fid_bin);

This outputs a "dataBin" array that is size 52428800x1. I am having trouble making sense of this data and matching it to the format described in section 23.8 of the mmWave Studio Users Guide. How can I reformat this file to correctly separate the in-phase and quadrature components of each sample and receive channel as described in the user guide?

Regards,

Josh

  • Josh,

    Look here "Mmwave Radar Device ADC Raw Data Capture", on section 6; page 9 you will find some example code.

    Alex

  • Thank you Alex, that guide was very helpful. I've now successfully gotten the raw data in a format that makes sense, but I'm a bit unsure about the results. Here is what I'm getting for raw data from the four receivers in the first 256 samples:

    This matches what I'm seeing in the default GUI, but it's a noisier signal than I was expecting. I simply set up a stationary corner reflector directly in front of the sensor, and used the default settings for the chirp parameters in mmWave Studio. I would expect to see neater sinusoidal waves like those in section 21.1.1.6 of the mmWave Studio user guide. How should I change my settings to get cleaner signals?

    Regards,

    Josh

  • Josh,

    Your plots look normal to me, the plot in the mmWave Studio (section 21.1.1.6) looks like it may have come from a test internal to the device or maybe an an-echoic chamber.
    As long as your output matches mmWave studio, I think you can move forward.

    Thanks
    Alex