This thread has been locked.

If you have a related question, please click the "Ask a related question" button in the top right corner. The newly created question will be automatically linked to this question.

AWR1642: Question about ADC FS and dBFS to dBm calculation

Part Number: AWR1642

Hello experts,

I'm Namhyung and have some question about the AWR1642 ADC full scale and dBFS to dBm conversion.

I understand that the FS (full scale) is ADC's maximum power. Based on this and also many of your previous documents, the maximum ADC swing is +-1 V (2Vp-p) and the FS would be 10 dBm (0dBFS).

If we use 16 bit ADC raw data, +-2^15 code value would be +-1V, is this right?

This is my test result tested with mmWave studio. (the left FFT data is plotted without FFT window)

In this result, the averaged amplitude is around 11000 code and this would be around 33.5% of the full scale. It means that the value would be ~ -9.5dBFS.

But the mmWave studio shows around -13.5 dBFS and it shows about 4 dB difference.

Why this kind of difference happens?

  • Hello Namhyung,

    I can't see the snapshot, could you re-share that.


    Regards,

    Jitendra

  • Hello Jintendra.

    Due to the security system problem of ours, the figure is not attached properly.

    I add another figure to ask my question as below.

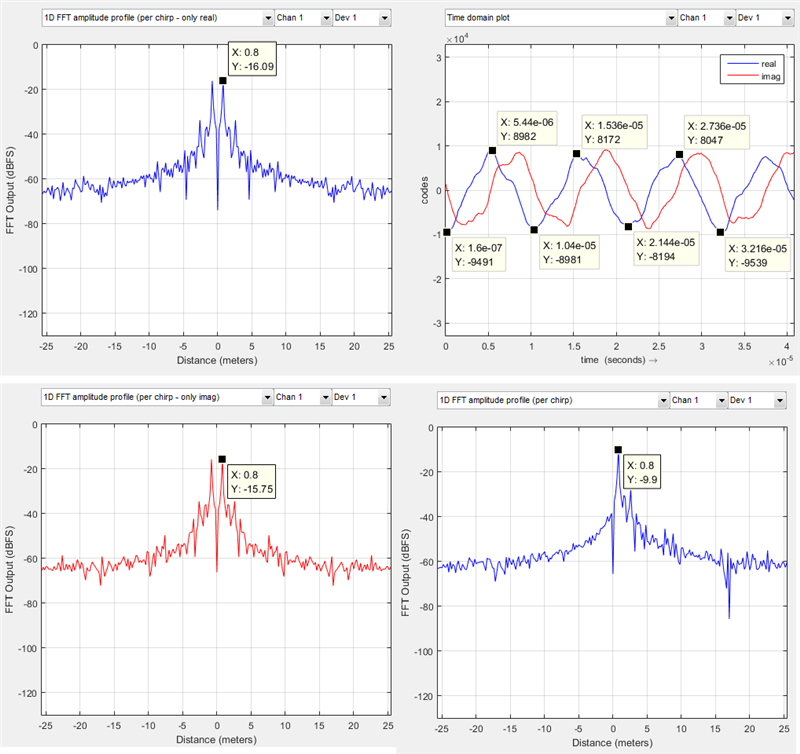
    As you can see above, the test result in the time domain shows around ~+-8620 amplitude single tone sinusoidal signal.

    (If you cannot see the figure, plz just imaging single tone sinusoidal signal with amplitude as described above)

    (the test is performed with 256 sample case and the raw data is achieved with 16 bit setup)

    In this case, if we set the maximum code value as 1V, the sine signal amplitude would be around 0.263V (8620/32768, 2^15=32768)

    With this value, if we calculate FFT output power, the power would be ~-11.6 dB. But as you can see above, the mmWave studio shows around ~-16dB.

    Why this kind of difference is happened? What is the right value?

    (If we set the code value as 0.6V (1.2Vpp), the FFT output power would be around ~-16 dB.)

    1. Maximum code value = +-1V

       -> FFT output power : -11.6 dB -> real power : -11.6 + 10 = -1.6 dBm

    2. Maximum code value = +-0.6V

      -> FFT output power : -16 dB -> real power : -16 + 10 = -6 dBm

  • Hello Scone,

    Apologize for the late reply.

    You are seeing the -16dBFS in the real only or complex only case. Since the power for each is spread out between the positive and negative freq (you can see two peaks). The complete power is 3dB higher , ie -13dBFS.

    Now if I see the time domain plot, the peak is around 8200 codes. A sin wave of 32768 code peak corresponds to 0 dBFS. So the dBFS calculation would be 20LOG (8200/32768) = -12dBFS. There is a 1dB delta from this and -13dBFS observed in the FFT plot and I think that is because its not a pure sin wave but distorted. So the energy is spread out in other bins as well.

    Regards,

    Vivek

  • Thank you Vivek!

    Now I understand clearly!

    Regard,

    Namhyung (scone)