This thread has been locked.

If you have a related question, please click the "Ask a related question" button in the top right corner. The newly created question will be automatically linked to this question.

AWR1243: Complex 1x IF Response

Part Number: AWR1243

Hello, 

I have a question about the baseband response in complex 1x mode shown in the figure below. 

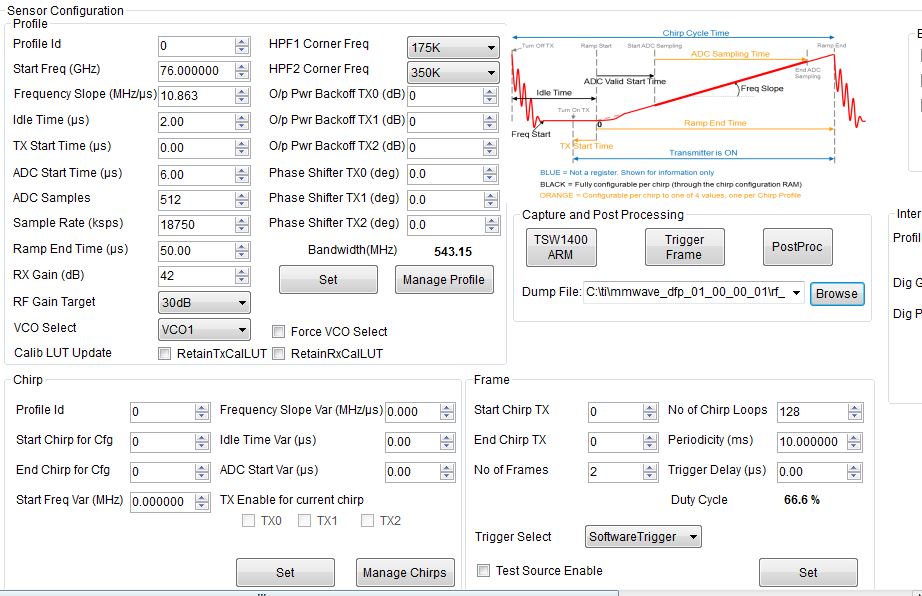
With the AWR1243BOOST + MMWAVE DEVPACK + TSW1400 board combination, adc data was collected and analyzed. 512 samples at 18.75 MHz data rate were collected for 128 chirps. In this figure, I show the averaged range FFT for each of the four receivers. They all seem to line up very well. 

However, the I was expecting a traditional spectrum of the high pass filter which is also visible in complex 2x mode. After about 16.75 MHz, the filter response starts to drop as expected but then at around 17.5 MHz it starts rising again and forms a bump and starts decaying again. I observe the same shape in complex 1x mode with the post processing tool in radar studio. Is this also observed at TI ? I would be very grateful for an explanation about this. Is this an artifact of the AAF +  Frequency Shifting ? 

Thanks !

RJ 


  • Hello RJ!

    Are you using the HPF in the chirp configuration? Would you be able to share what parameters you are using for this?

    Someone should have a more illustrated response for you sometime on Monday.

    Cheers,
    Akash
  • Hi Akash:

    Thank you so much for your reply. I am using the HPF1 and HPF2 with 175kHz and 350 kHz cut-off frequency respectively.

    The settings used to capture the data are attached with this message.

    Regards,

    RJ

  • Hello
    Due to the DFE filtering of 90% signals beyond 17.8Mhz are not usable within the system. In your graph with all of the Tx turned off, The receivers have a noise profile, convolved with the digital filters. The Rx LNA gain of 42db (24-48) is Ok.

    In complex 2x mode, the top of the spectrum is 9.375Mhz. There should be a symmetric filter for the -Fs/2 to Fs/2 end of the plot. The HPF settings should show a null in the center of the plot.

    In complex 1x mode, the left edge is zero, where the HPF filter should be shown. The right edge of the filtering is the complex Fs. The artifacts of filtering and decimation can show up here. Whe you discuss the Frequency shifting, these would show up near the center of Complex 1x band. Because of the shifting, we do have negative frequency image that is rotated to the right edge, before A7 decimation filter and AAF filter.
    We expect these image products to be filtered by A7 and the AAF filters.

    Regards,
    Joe Quintal
  • Hi Joe

    Thank you so much for your detailed response. I appreciate it very much. 

    Regards,

    RJ