


Part Number: TDC1000-TDC7200EVM
Is this graph similar to amplitude vs no of samples?
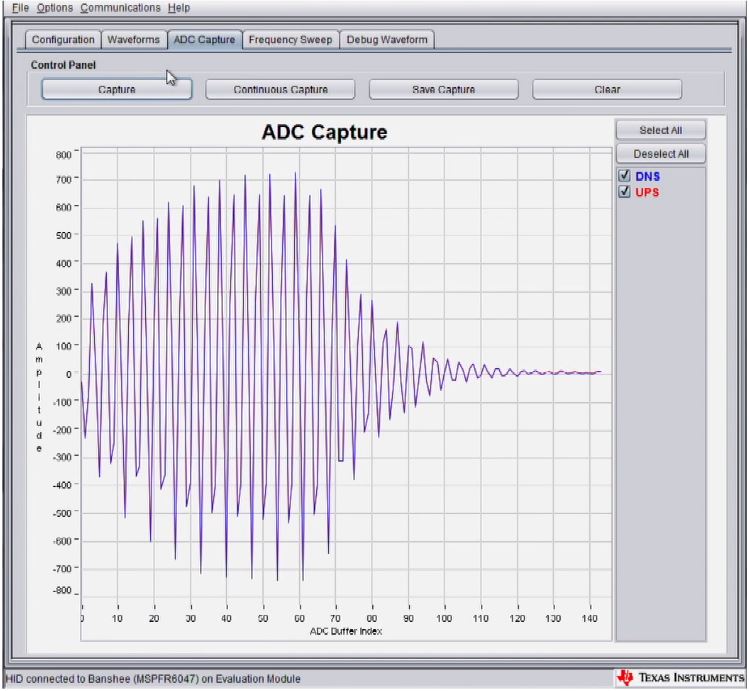
If yes, can I capture this type of graph from the TDC1000-TDC7200EVM module?
Original question:

Part Number: TDC1000-TDC7200EVM
Is this graph similar to amplitude vs no of samples?
If yes, can I capture this type of graph from the TDC1000-TDC7200EVM module?
