This thread has been locked.

If you have a related question, please click the "Ask a related question" button in the top right corner. The newly created question will be automatically linked to this question.

IWR1642: Generate Time-Integrated Range Doppler Maps using MMWave Demo Visualizer FHist Data

Part Number: IWR1642

Hello,

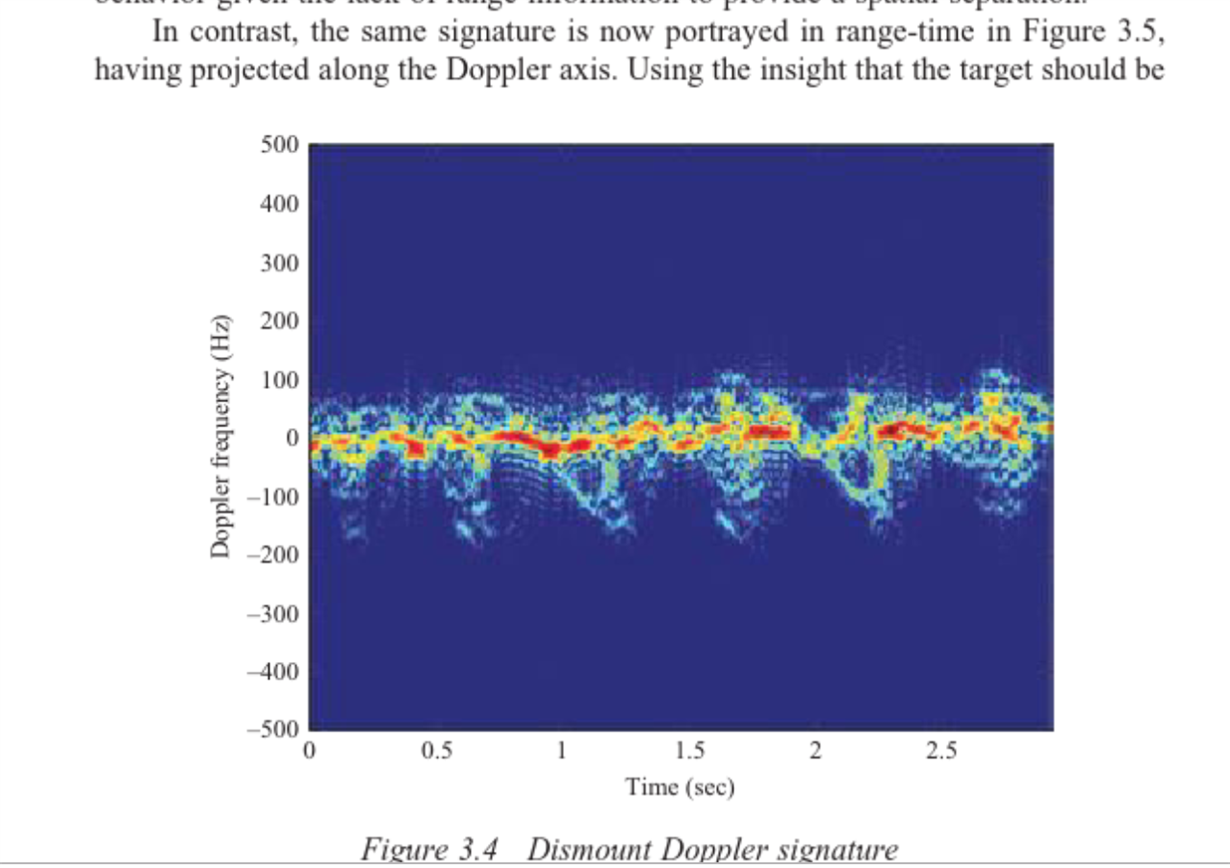
I'm trying to generate Time-Integrated Range Doppler Maps in Matlab using the FHist Data captured using the MMWAVE Demo Visualizer, and I'd like some help figuring out how to do this. Specifically I want to generate time-integrated range doppler maps of people walking, as shown in the image below. How do I generate a plot like this using the Fhist data? The image is taken from Victor Chen's book Radar Micro-Doppler Signatures: Processing and Applications. Thanks. 
  • Former Member
    0 Former Member
    Hello Isaac,

    To clarify the fhist data structure is exported from the people counting based labs that use group tracker. This data structure is processed point cloud and tracked object data. It does not log this kind of low level "raw" data.

    The mmWave Demo Visualizer is used in conjunction with the mmWave SDK out of box (OOB) demo. This does not log fhist files. You can however log the UART stream from the device while the demo is running. If you have the doppler range plot enabled then you can extract the information from this plot to reconstruct a doppler time plot. If you enable data logging in mmWave Demo visualizer this is exported as a .dat file and you will need MATLAB to extract and work with the data.

    Amanda