This thread has been locked.

If you have a related question, please click the "Ask a related question" button in the top right corner. The newly created question will be automatically linked to this question.

AWR1642BOOST: High Accururacy Range Measurement lab example

Part Number: AWR1642BOOST
Other Parts Discussed in Thread: AWR1642

Dear customer support,

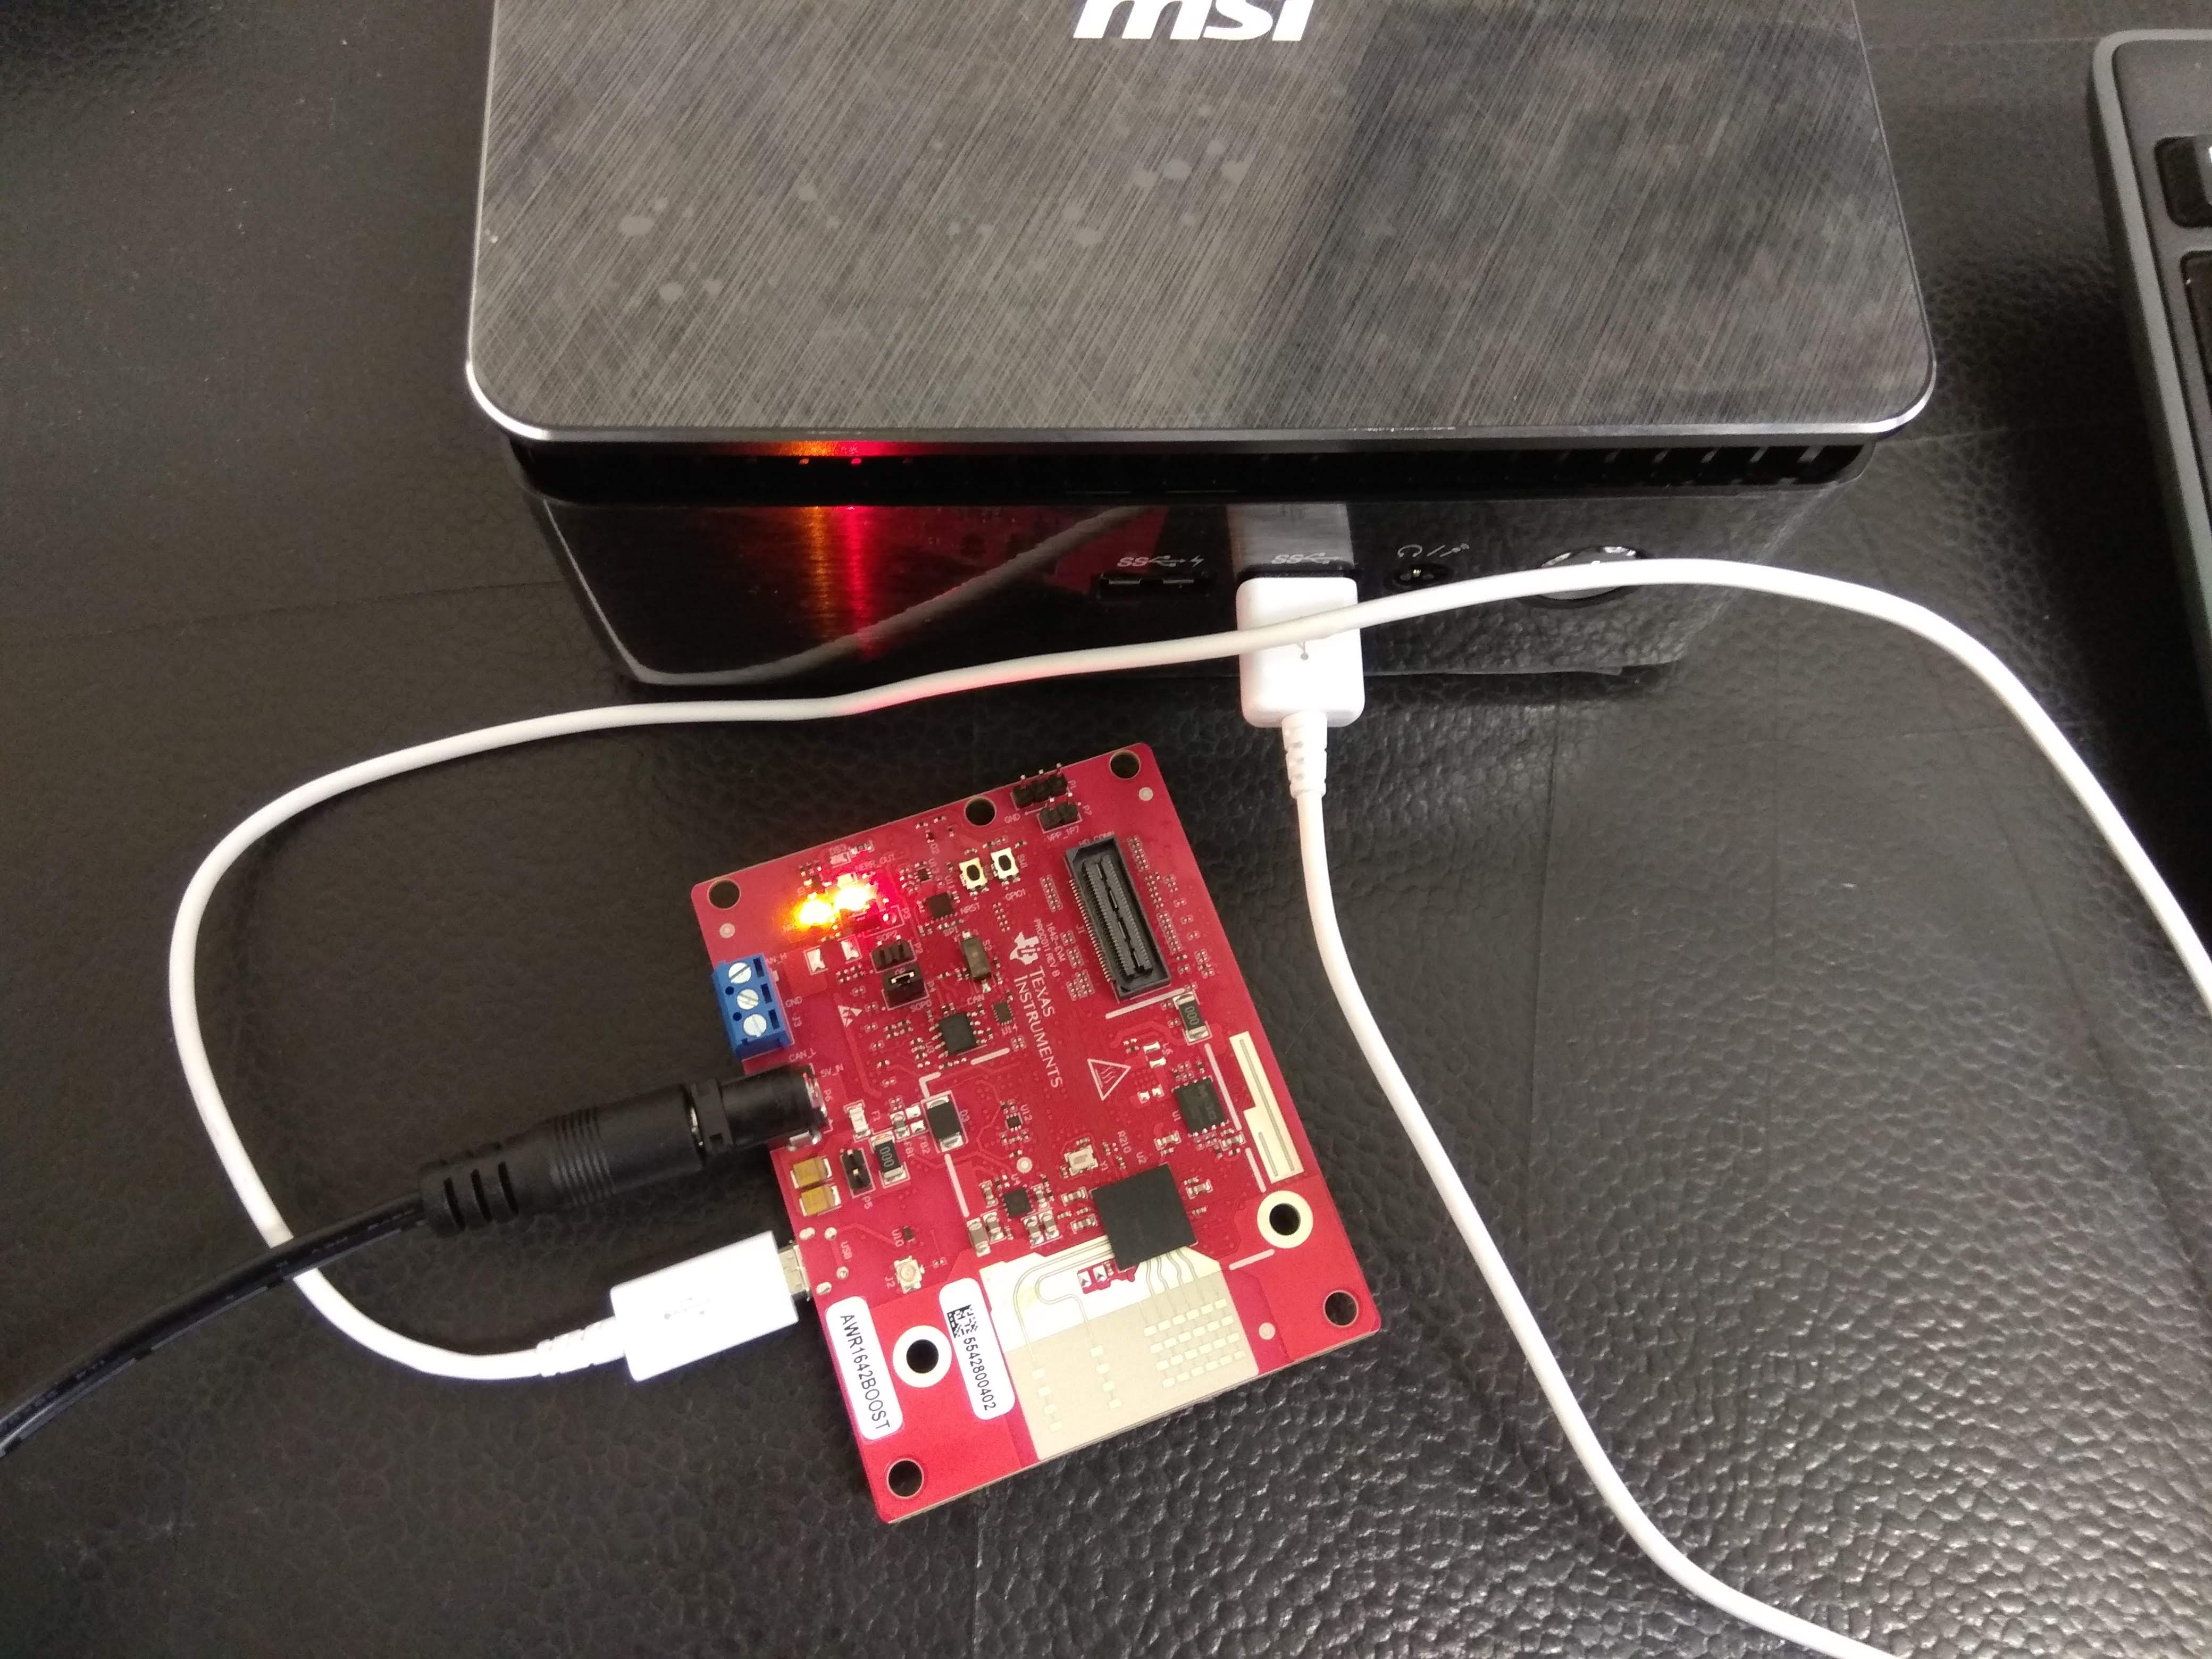
I have AWR1642 connected to my computer directly (without any interface boards) as shown in the picture below. My task is to use the device as a short range radar with the highest possible resolution.  

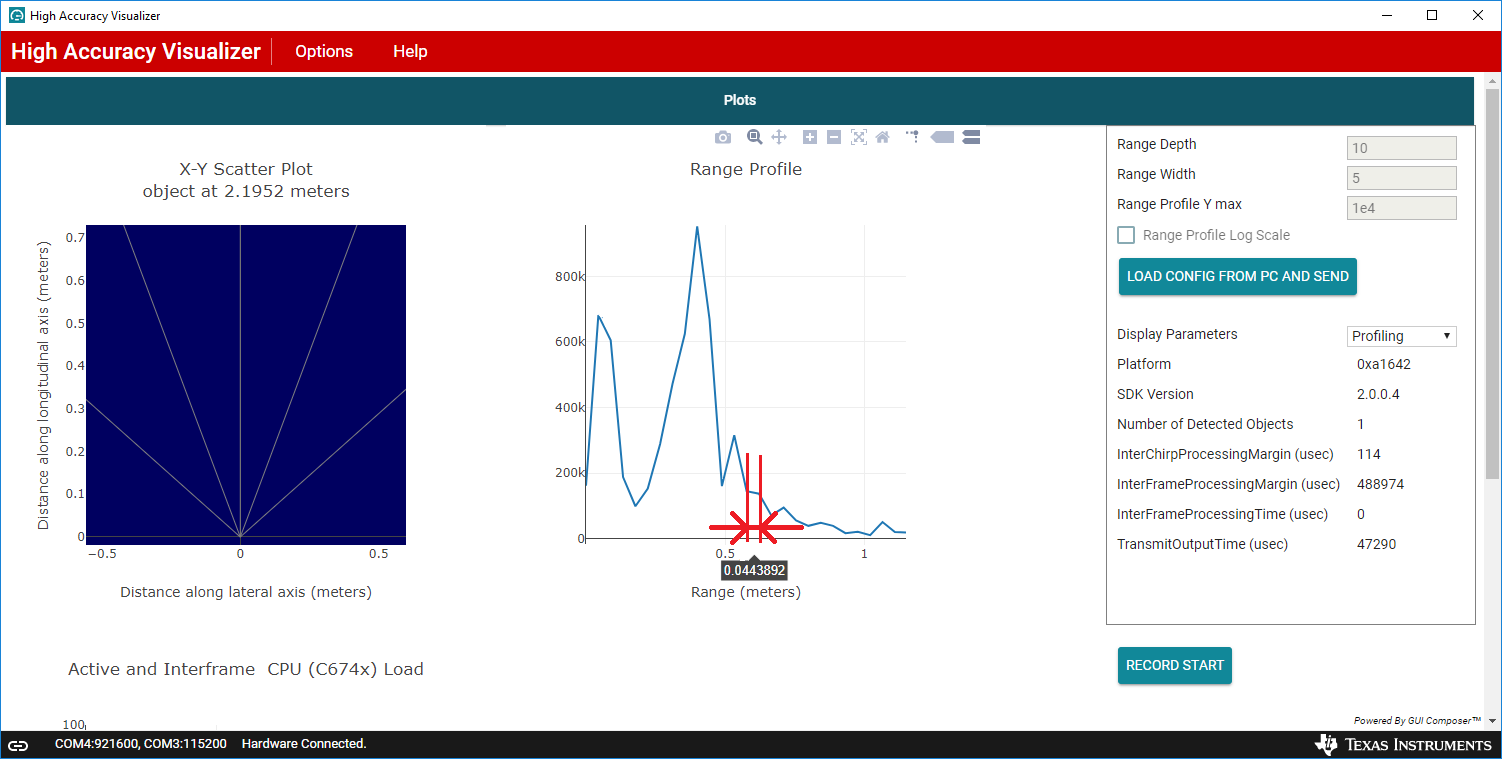
I used xwr16xx_high_accuracy_lab.bin from High Accuracy Lab together with High Accuracy Visualizer. But I met several issues. 

1. The resolution achieved in the Range Profile chart is much lower than I expected according to other discussions found in the forum. The distance between the diagram measurements is .0444 m. I hope to reach 1 mm.or even less. Is it possible? 

2. Can you advise the simplest way to receive the highest resolution data in a small distance interval from AWR1642? Can it be obtained by programming? 

Thank you,

Peter

  • Hi,

    Please make sure that you are clear about the distinction between accuracy and resolution.

    This topic has been discussed extensively

    e2e.ti.com/.../600579
  • Hi Petro,

    The 4.4 cm you are seeing is simply a limitation of the visualizer and not the demo itself. The High Accuracy Lab can achieve accuracy of 1mm or better provided you have made an appropriate setup. This includes a fixed mount, clutter free scene, and even lensing if necessary.


    Cheers,
    Akash
  • Dear Akash,

    Thank you for the explanation.

    But I have more questions.

    Now, I record a metal egg of chicken egg size. It is located in the front of the AWR1642 antenna on the distance of 10-30 cm. I use High Accuracy Visualizer standard setup (c:\ti\mmwave_industrial_toolbox_3_3_1\labs\lab0005-high-accuracy-16xx\lab0005_high_accuracy_16xx_pjt\accuracyTest1.txt) with a minor correction of the distance interval by "RangeLimitCfg 2 1 0.1 0.4" (to fit my distances of 0.1-0.4 m).

    But I met couple issues:
    1) High Accuracy Visualizer always shows wrong distance. The measurement error is about 2-4 cm or 10%. For example, it shows 31 cm instead of 27 cm.
    2) The distance value is stable enough while the egg is in not moved. But a smallest change related to very accurate rotation of the egg changes the calculated distance value by 2-4 mm. I don't see any physical reasons for the difference.

    Can you please recommend the setup parameters appropriate for detection a close enough small static object?
    I hope the mesuring precision can be improved by changing the configuration.

    Thank you again,
    Petro

  • Hi Petro,

    You may need to calibrate the visualizer, this would have to be done manually using the mmWave Demo Visualizer.

    I'd recommend trying the visualizer for the Fluid Level Transmitter which has this correction applied.


    Cheers,
    Akash
  • .
    Hi Akash,

    Thank you very much!
    I'll try

    Best regards,

    Peter