This thread has been locked.

If you have a related question, please click the "Ask a related question" button in the top right corner. The newly created question will be automatically linked to this question.

AWR1642BOOST: [Demo Visualizer / SDK 3.2] Objects in heatmap smeared over distance

Part Number: AWR1642BOOST

Hi together,

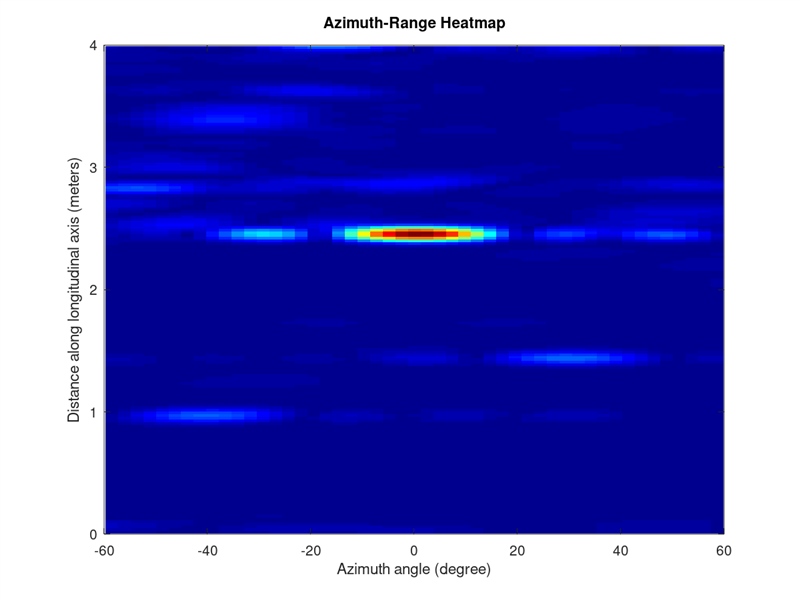
when evaluating the heatmap with the mmWave Demo Visualizer, I observe targets are depicted not in a single, but rather "smeared" over multiple adjacent range bin, as the following figure shows:

Note how the axes are not Cartesian coordinates but range and azimuth and therefore depict the scene without the optical transformation done by the Visualizer (this representation therefore refers to the content of the fliplrQQ-variable in the Visualizer's source code).

This smearing seems to be rather symmetric and normally distributed in distance over the maximum reflection in the respective center. Is this due to multipath propagation? If so, shouldn't the maximum be at the front (smallest range bin) and decaying to the back?

To rephrase my question: some reflected energy seems to be from surfaces located closer to the sensor, some from further away with the maximum in between. Where does this (symmetric!) distribution stem from?

  • Hi,

    Under which scenario you observe this plot? It will be helpful if you provide the setup and scene details.

    I don't see this kind of plot with the default configuration.

    Regards,

    Jitendra

  • Its just an indoor scene in an office room. The targets at (1 m distance, -40° azimuth) and (1.5 m distance, 30° azimuth) are metallic bins, the large target  at (2.5 m distance, 0° azimuth) is a metallic cupboard. The rest is clutter from desks, chairs and other surfaces around.

    The sensor is mounted on a tripod about 1 m above the floor. For the configuration parameters, see below:

    % ***************************************************************
    % Created for SDK ver:03.02
    % Created using Visualizer ver:3.2.0.1
    % Frequency:77
    % Platform:xWR16xx
    % Scene Classifier:best_range_res
    % Azimuth Resolution(deg):15
    % Range Resolution(m):0.041
    % Maximum unambiguous Range(m):8.95
    % Maximum Radial Velocity(m/s):1
    % Radial velocity resolution(m/s):0.13
    % Frame Duration(msec):500
    % Range Detection Threshold (dB):15
    % Doppler Detection Threshold (dB):15
    % Range Peak Grouping:enabled
    % Doppler Peak Grouping:enabled
    % Static clutter removal:disabled
    % Angle of Arrival FoV: Full FoV
    % Range FoV: Full FoV
    % Doppler FoV: Full FoV
    % ***************************************************************
    sensorStop
    flushCfg
    dfeDataOutputMode 1
    channelCfg 15 3 0
    adcCfg 2 1
    adcbufCfg -1 0 1 1 0
    profileCfg 0 77 387 7 100 0 0 40 1 272 2956 0 0 30
    chirpCfg 0 0 0 0 0 0 0 1
    chirpCfg 1 1 0 0 0 0 0 2
    frameCfg 0 1 16 0 500 1 0
    lowPower 0 1
    guiMonitor -1 1 1 0 1 0 0
    cfarCfg -1 0 2 8 4 3 0 15 1
    cfarCfg -1 1 0 4 2 3 1 15 1
    multiObjBeamForming -1 1 0.5
    clutterRemoval -1 0
    calibDcRangeSig -1 0 -5 8 256
    extendedMaxVelocity -1 0
    bpmCfg -1 0 0 1
    lvdsStreamCfg -1 0 0 0
    compRangeBiasAndRxChanPhase 0.0 1 0 1 0 1 0 1 0 1 0 1 0 1 0 1 0
    measureRangeBiasAndRxChanPhase 0 1.5 0.2
    CQRxSatMonitor 0 3 9 125 0
    CQSigImgMonitor 0 89 6
    analogMonitor 0 0
    aoaFovCfg -1 -90 90 -90 90
    cfarFovCfg -1 0 0 8.86
    cfarFovCfg -1 1 -1 1.00
    sensorStart

  • Hi at all,

    I believe to have solved it on my own: My guess is that the smearing is simply a result of zero-padding when calculating the 1D-/Range-FFT.

    As zero-padding stretches the number of available frequency bins, every target gets smeared in range. This effect is more powerful the larger the ratio of numRangeBins/numAdcSamples is (minimum 1, supremum 2). As you can see from my configuration, it is 512/272, so the effect is rather noticeable.

    Jitendra, I would be very pleased if you would still take your time and confirm me this assumption.