Here are the list of queries on mmWave Sensor Visualizer.
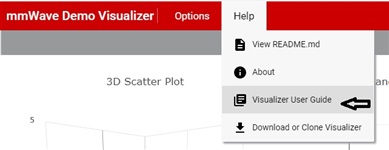
Q1. Where can I find mmWave Demo Visualizer User guide document?
In the mmWave Demo Visualizer page, user guide document is linked under the help menu, please refer this snapshot
https://www.ti.com/lit/ug/swru529c/swru529c.pdf
Q2. Not able to connect from mmWave Demo Visualizer
Answer:
- Make sure that TICLoudAgent Bridge (browser extension) is installed on the browser (preferably Chrome) to use the Visualizer.
- Refer troubleshooting page to find some level of solution regarding the TICloudAgent
- http://processors.wiki.ti.com/index.php/TI_Cloud_Agent#Troubleshooting
- Make sure USB cable with EVM is already connected with the system before starting the Visualizer or refresh the Visualizer page.
- Goto Visualizer-> Options-> Serial Port: click refresh button on the popup window.
- Try connecting COM port from other serial application (e.g. TeraTerm) to make sure that COM port is accessible to connect.
- Restart the PC if COM port is blocked by some application in the background.
Q3. Not able to get the Plot with mmWave Demo Visualizer
Answer:
- Compatible application (mmw demo) should be running on mmwave sensor and it should be of same SDK version and device type which Visualizer supports.
- If sending config commands doesn’t appear to ‘console message’ window then
- first check if right COM port is connected to CFG_PORT and DATA_PORT with right baud rate.
- Disconnect COM ports from Visualizer and now try to connect CFG_Port with a serial Terminal tool (as TeraTerm) and hit enter, you should get the prompt “mmwDemo:/>”. Try giving “version” command over same prompt, is it reverting right version?
- Before sending any cfg command, Visualizer sends ‘version’ command in background to get to know the matching version. If it doesn’t get any response from the application over data_port or non-support version then it won’t proceed further to send cfg commands. So check over serial terminal for ‘version’ command.
- Next assuming Visualizer is able to send all the cfg commands but still not getting any plot
- Again go back to TeraTerm connection but this time connect two separate COM ports (CMD_Port and Data_Port) at same baud rate.
- Send one by one all the CFG commands from *.cfg (in mmw demo profile folder) over TeraTerm (CMD_port) and check if all the commands return DONE message.
- At last, when you send sensorStart command from the same TeraTerm console, on another console (DATA_port) you should see some data coming up (may not be readable: binary object result data). So this way it proves that device is fine and pumping out object data over Data_port, there is some issue with Visualizer connection or execution.
- At this step try to use other browsers or PC to open Visualizer. Or reinstall the TICloudAgent extension.
Q4. Adding a new plot to visualizer or sending in b/w result data out.
Answer: mmWave Demo Visualizer is a javascript based tool which user can import to their workspace (dev.ti.com) and modify it as needed. Please refer these similar threads-
https://e2e.ti.com/support/sensors/f/1023/p/774239/2864305#2864305
https://e2e.ti.com/support/sensors/f/1023/p/607492/2237366
Q5. Capture the object result to a file using mmWave Demo Visualizer
Answer: Refer related thread: https://dev.ti.com/gallery/view/mmwavebeta/mmWave_Demo_Visualizer_Record/ver/3.1.0/
Q6. How to parse captured object data file from Visualizer?
Answer1: refer related thread https://e2e.ti.com/support/sensors/f/1023/t/684872
Answer2: For mmawave SDK 3.2 and Visualizer version 3.5, updated python script can be found in this thread:

UPDATED : e2e.ti.com/.../awr1642boost-mmwave-demo-visualiser-captured-data


