This thread has been locked.

If you have a related question, please click the "Ask a related question" button in the top right corner. The newly created question will be automatically linked to this question.

OPT3002: Measurement output result(ADC codes) vs Temperature

Guru 21045 points
Part Number: OPT3002

Hi Team,


We need Measurement output result(ADC codes) vs Temperature Graph.

Because, we would like to know the temperature dependability for output result.


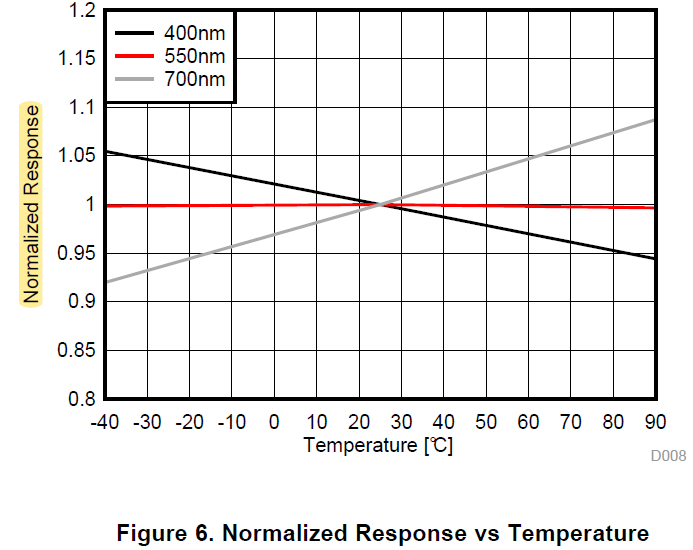
I understand that " Normalized Response of Figure 6" is the same as " Measurement output result ".

Is my understanding correct?

And, would you send " Measurement output result(ADC codes) vs Temperature" if you have any other data?


Regards,

Hide

  • Hi Hide,

    This graph should have the information you are looking for.The data on the y axis is normalized to 25 degrees C for each wavelength. Normalized reading at temperature T = (device output at T)/(device output at 25C) for each wavelength.

    Best,

    Alex 

  • Hi Alex-san,


    Thank you for your prompt reply.


    I understand that If Output result of 400nm is 2500 at 25℃,

    -Output result is 2625 (1.05*2500) at -40℃

    -Output result is 2375 (0.95*2500) at 90℃


    And, If Output result of 550nm is 2500 at 25℃, Output result is 2500 at all temperature.

    Is my understanding correct?


    Regards,

    Hide

  • Hi Hide-san,

    Yes this is correct. However, I'd like to note that 2500 here refers to 2500 lux since device output will consist of mantissa and range setting data. There is a formula for converting between lux and device result register raw codes in the datasheet. Also wanted to note that the 1.05 and .95 is approximate as the line is a little past this value. This are both minor points though and your understanding seems correct here.

    Best,

    Alex

  • Hi Alex-san,

    Thank you for the information.

    I’d greatly appreciate your verification.

    Regards,

    Hide