Hi,
I did some tests with the ADS1672EVM + MMB0 recently. When I tried to record the input noise spectrum of my system, I realized that the noise floor displayed in the MultiFFT tool of ADCPro differed a lot among the different runs of my measurement. After several days of EMI shielding ;-) , I tried a different thing: I recorded the ADC values of each run in the time-domain to a text file and calculated an FFT from that with external tools. I found out that the amplitudes of noise floors in the result are, in fact, pretty much the same for all measurement runs. I confirmed this with three algorithms, a standard "school DFT" algorithm (by myself), a downloaded FFT algo for C# (Excocortex.DSP) and the FFT-Tool from MS Excel, all of which provided exactly the same results (for the first 14 places after point). Then I fed two of these recordings, "Signal 12" and "Signal 13", back to ADCPro (see attachement) and found out that, for the rectangular window, the noise floor for "Signal_12" is at -100 dBFS and for "Signal_13" the noise floor is at -120 dBFS. With other window functions, the difference is even greater.
You can find the signals (text files) and screenshots of ADCPro in the attachement. I also added two excel tables, which compare the outputs of ADCPro with the outputs of the Exocortex FFT algorithm. I used the first N/2 samples of the spectrum and multiplied it with 2.0, then calculated DBFS from that. I ignore the first and last sample. The results for the two runs are pretty much the same.
Can you help me on this? Is there something I overlooked? (You will find the attachements below...)
Best regards,
Markus.
8372.EVK_V120_SpectrumPosition.zip
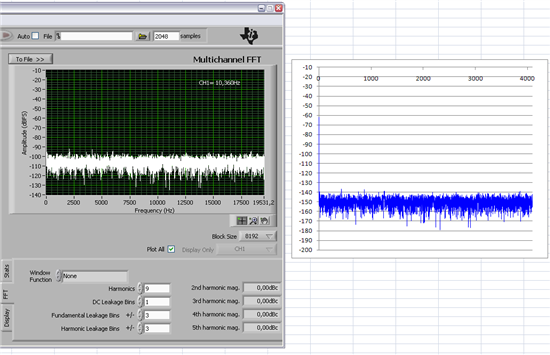
Here is the output for "Signal 12":
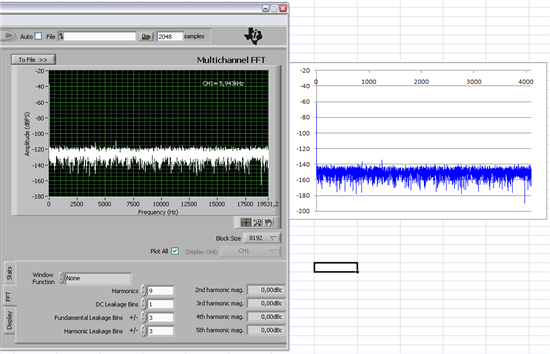
Here is the output for "Signal 13" (Please note: the scale of the Y-axis is different from the diagram above, but this is not what I mean):
Here is the version info of ADCPro: